
Email marketing can feel confusing sometimes. You send a campaign, you see an open rate, a click rate, and a bunch of other numbers, and you are left wondering one thing: Is this good or bad?
This blog will make it simple. You will learn the email campaign performance metrics that actually matter, what “good” looks like in 2025, and how to improve results without doing anything shady or spammy. You will also learn how to read open rates the right way, since they can be useful, but also misleading if you rely on them too much.
What Email Performance Metrics Really Tell You
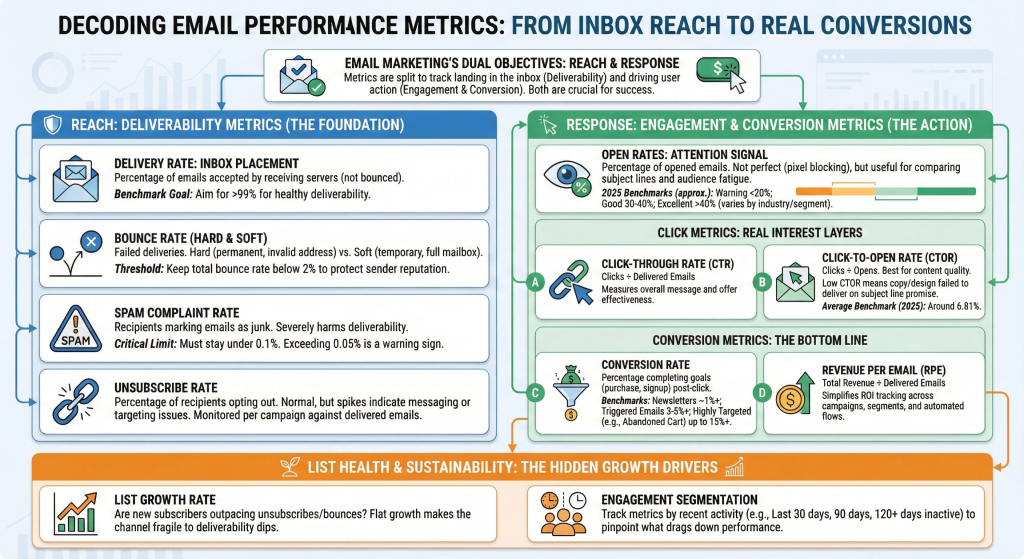
Every email campaign has two jobs:
- Reach inboxes (deliverability)
- Get action (engagement and conversions)
That means you need two sets of metrics:
- Deliverability metrics (Did emails land in inboxes?)
- Engagement metrics (Did people open, click, and buy?)
If you only look at open rates, you miss half the story. A campaign can have strong opens but weak sales. Another can have average opens but high conversions. So it is important to watch metrics as a group.
Open Rates: What They Mean and Why They Can Be Tricky
Open rate is the percentage of people who opened your email.
Most tools calculate it like this:
- Opens ÷ Delivered emails × 100
It is a helpful signal, but it is not perfect because some email clients block tracking pixels. Also, some “opens” may not reflect real human attention.
Still, open rate is useful for:
- Comparing subject lines
- Spotting audience fatigue
- Checking if your targeting is right
What Is a Good Open Rate in 2025?
Benchmarks vary depending on the platform and audience quality. But these are useful reference points:
- MailerLite reported an average email open rate in 2025 of 43.46% across industries, with 2024 at 42.35%.
- HubSpot cites an average open rate across industries of 42.35% in 2025 benchmarks.
- Bloomreach notes that well-segmented senders often reach 30–40% on bulk campaigns, with a common “golden standard” of at least 20%+.
- Klaviyo reported an average campaign open rate of 37.93%, with the top 10% reaching 54.78% (UK data set).

The takeaway: If you are consistently below 20%, something is off. It might be list quality, subject lines, deliverability, or weak segmentation.
Click Metrics: The Real Engagement Layer
Clicks are where you start seeing actual interest.
Click-Through Rate (CTR)
CTR measures how many recipients clicked a link out of total delivered emails.
CTR tells you if your message and offer worked. A subject line can get opens, but the body has to earn the click.
Click-to-Open Rate (CTOR)
CTOR measures clicks out of opens.
This is one of the best “content quality” metrics because it removes deliverability from the equation. If your CTOR is low, it often means the email copy, design, or call-to-action did not match expectations set by the subject line.
MailerLite reported an average click-to-open rate in 2025 of 6.81%. That gives you a rough benchmark for what “normal” looks like.
Deliverability Metrics That Protect Your Sender Reputation
Deliverability metrics do not feel exciting, but they keep your email program alive. If you ignore them, inbox placement drops, open rates fall, and you start wondering why email “stopped working.”
Delivery Rate
This is the percentage of emails accepted by receiving servers. Many tools use “delivered” to mean it was not bounced.
Bloomreach documentation flags delivery rates below 99% as a warning threshold for deliverability health.
Bounce Rate (Hard vs Soft)
A bounce means your email did not deliver.
- Soft bounce: temporary issue (mailbox full, server issue)
- Hard bounce: permanent issue (invalid address)
Warmforge suggests keeping bounce rate below 2% to avoid harming sender reputation. Their table also shows a US industry average of 2.70% (context dependent), which is a signal that many senders run too “dirty” of a list.
Spam Complaint Rate
Spam complaints are one of the fastest ways to damage deliverability.
Warmforge suggests spam complaint rate should stay under 0.1%. Bloomreach also flags spam complaint rate above 0.05% as a threshold to watch.
If spam complaints rise, do not “send more.” Pause and fix what is wrong.
Unsubscribe Rate
Unsubscribes are normal. They can even be healthy because they remove people who do not want your emails. But if it spikes, something in your messaging or targeting is off.
Klaviyo notes unsubscribe rate is typically calculated as unsubscribes divided by delivered emails, measured per campaign.
Conversion Metrics: The Numbers That Matter Most
A strong open rate feels nice, but conversions pay the bills.
Conversion Rate
This is how many recipients completed your goal (purchase, booking, signup) after clicking.
Bloomreach suggests a 2025 benchmark of 1%+ conversion rate for newsletters, 3–5%+ for triggered emails, and up to 15%+ for highly targeted campaigns like abandoned cart flows.
These numbers will vary by industry, product price, and list quality, but the pattern stays true: triggered and personalized emails convert better.
Revenue Per Email (RPE)
Revenue per email is great because it simplifies everything into one number.
Revenue per delivered email helps you compare:
- Different campaigns
- Different segments
- Broadcast vs automation
- Promotions vs content
If you want to get serious about email ROI, track RPE monthly.
List Health Metrics Most Brands Ignore
When email “stops working,” it is often because list health slowly declined.
List Growth Rate
Are you gaining new subscribers faster than you lose them?
If your list growth is flat, your email channel becomes fragile. One deliverability dip can hurt badly because there is no fresh engagement coming in.
Engagement Segments
Create segments like:
- Opened or clicked in last 30 days
- Opened or clicked in last 90 days
- No engagement in 120+ days
Then compare metrics by segment. You will quickly see which part of your list is dragging down performance.
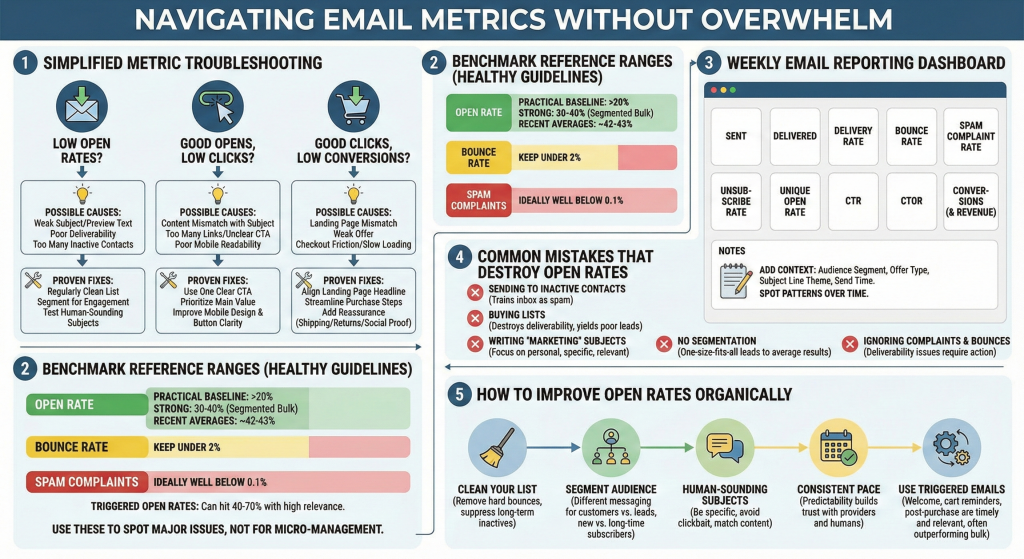
How to Use Metrics Without Driving Yourself Crazy
A lot of teams track too many numbers and end up making random changes.
Here is a simple way to think about it:
If Open Rates Are Low
Possible causes:
- Weak subject lines or preview text
- Poor inbox placement due to deliverability issues
- Sending to inactive subscribers too often
Fixes that usually work:
- Clean your list regularly (remove hard bounces, suppress inactive contacts)
- Segment your audience so engaged people get more emails
- Test subject lines that sound like a real human wrote them
If Opens Are Fine but Clicks Are Low
Possible causes:
- Email content does not match the subject line promise
- Too many links or unclear CTA
- Email is hard to read on mobile
Fixes:
- Use one clear call-to-action
- Place the main value up top
- Make buttons bigger and copy clearer
If Clicks Are Fine but Conversions Are Low
Possible causes:
- Landing page mismatch
- Offer is not strong enough
- Checkout friction or slow load time
Fixes:
- Match the landing page headline to the email message
- Reduce steps to purchase
- Offer reassurance like shipping info, returns, or social proof
Benchmarks: A Simple Way to Compare Your Results
Benchmarks are helpful, but do not treat them like laws. Your best benchmark is your own history.
Still, here are “healthy ranges” based on recent benchmark sources:
- Open rate: 30–40% is strong for segmented bulk campaigns, 20%+ is a practical baseline.
- Average open rate reference points: 42.35% (HubSpot), 43.46% (MailerLite 2025).
- Bounce rate: keep under 2%.
- Spam complaints: under 0.1% (and ideally well below).
- Triggered open rates: can hit 40–70% with relevance and small segments.
Use these to spot big issues, not to obsess over decimal points.
Practical Email Reporting Dashboard (What to Track Weekly)
If you want a simple weekly dashboard, track these 10 metrics:
- Sent
- Delivered
- Delivery rate
- Bounce rate
- Spam complaint rate
- Unsubscribe rate
- Unique open rate
- CTR
- CTOR
- Conversions (and revenue)
Then add notes like:
- Audience segment
- Offer type
- Subject line theme
- Send time
Over a few months, you will start seeing patterns that make improving email feel easy.
The Biggest Mistakes That Kill Open Rates
These are common, and they sneak up on good marketers.
- Sending too often to inactive people: This trains inbox providers to treat you like spam.
- Buying lists: It destroys deliverability and usually produces bad leads.
- Writing “marketing subject lines”: People open emails that sound personal, specific, and relevant.
- No segmentation: One-size-fits-all emails usually lead to average results.
- Ignoring complaints and bounces: Deliverability problems rarely fix themselves.
How to Improve Open Rates Without “Tricks”
If you want better open rates, focus on trust and relevance.
Here are real improvements that work:
- Keep your list clean
- Remove hard bounces
- Suppress people who have not engaged in 120 to 180 days
- Segment your audience
- Send different emails to customers vs leads
- Separate new subscribers from long-time subscribers
- Make subject lines sound human
- Be specific
- Avoid clickbait
- Match the content inside the email
- Send at a consistent pace
- Inbox providers like predictability
- So do humans
- Use more triggered emails
- Welcome series, cart reminders, post-purchase emails
- Triggered emails can outperform bulk sends because they are timely and relevant
Wrap Up
Email campaign performance metrics are not just numbers on a dashboard. They are signals that tell you if your emails are reaching inboxes, keeping attention, and driving real business results.
Open rate is a helpful starting point, but it should never be the only metric you trust. Pair it with click rates, conversion rates, and deliverability health metrics like bounce rate and spam complaints. When you track the full picture, improving your email program becomes much easier and way less stressful.
If you want one simple next step: pick five metrics, track them weekly for a month, and make one change at a time. You will be surprised how quickly your open rates and results start moving in the right direction.


Leave a Comment