Ever wondered how much each customer support ticket really costs your business? It’s one of those hidden numbers that can make or break your bottom line. Support teams handle thousands of requests every year, and every email, chat, or call adds up fast.
In today’s fast-paced world, knowing your support cost per ticket helps you spot waste and boost efficiency. This post breaks down the latest stats, benchmarks, and tips to keep those costs in check. Stick around for real examples and actionable steps.
Defining Cost Per Ticket Clearly
Cost per ticket measures the average expense to fully resolve one customer support request. It includes agent salaries, tools, training, and shared overhead like office costs.
This metric gives managers a clear picture of helpdesk efficiency. High numbers signal bloat, low ones show smart operations.
For example, a $40,000 monthly budget resolving 1,500 tickets equals about $26.67 each. Track it to catch drifts early.
Many teams miss indirect costs, leading to rosy but false views. Always factor everything for accuracy.
How to Calculate It Right?
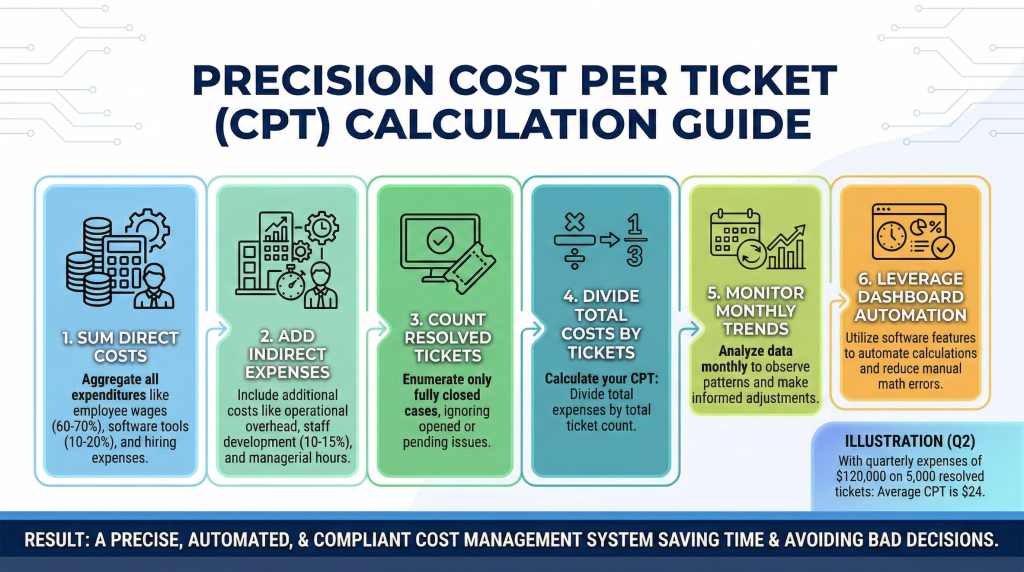
Follow these steps for spot-on numbers:
- Tally direct costs: Salaries (60-70%), software (10-20%), recruiting.
- Add indirects: Overhead, training (10-15%), management time.
- Count resolved tickets only, not opened ones.
- Divide total costs by tickets: Costs / Tickets = CPT.
- Repeat monthly for trends.
Say your quarterly spend hits $120,000 on 5,000 tickets: $24 average. Adjust for seasons like holidays.
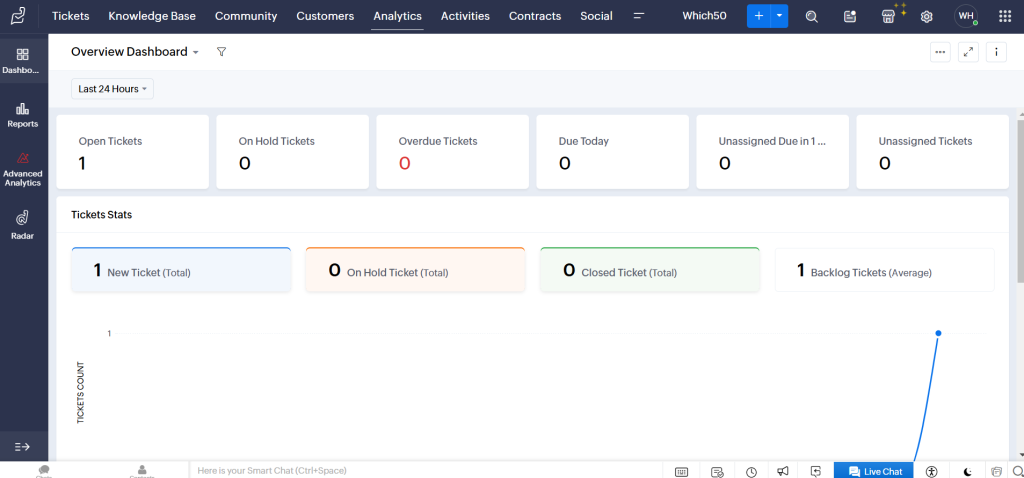
Use dashboards in tools for automation. Manual math errors cost thousands in bad decisions.
Current Global Averages
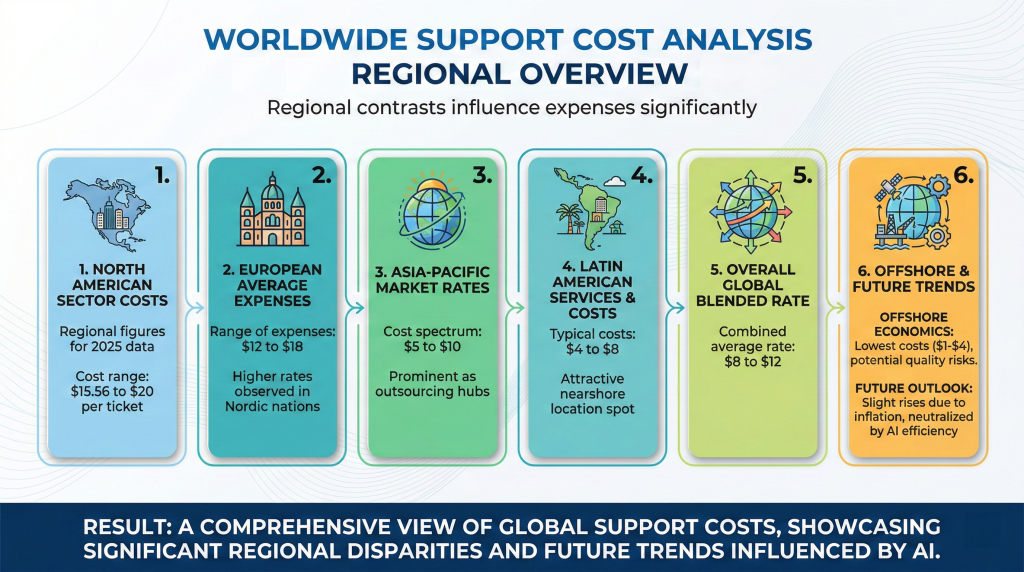
Regional differences drive big variations. North America averages $15.56-$20 per ticket in 2025 data.
- Europe: $12-18, higher in Nordics.
- Asia-Pacific: $5-10, outsourcing hubs shine.
- Latin America: $4-8 nearshore sweet spot.
- Global blended: $8-12.
Offshore dips to $1-4 but risks quality. Trends show slight rises with inflation, offset by AI.
Industry Benchmarks at a Glance
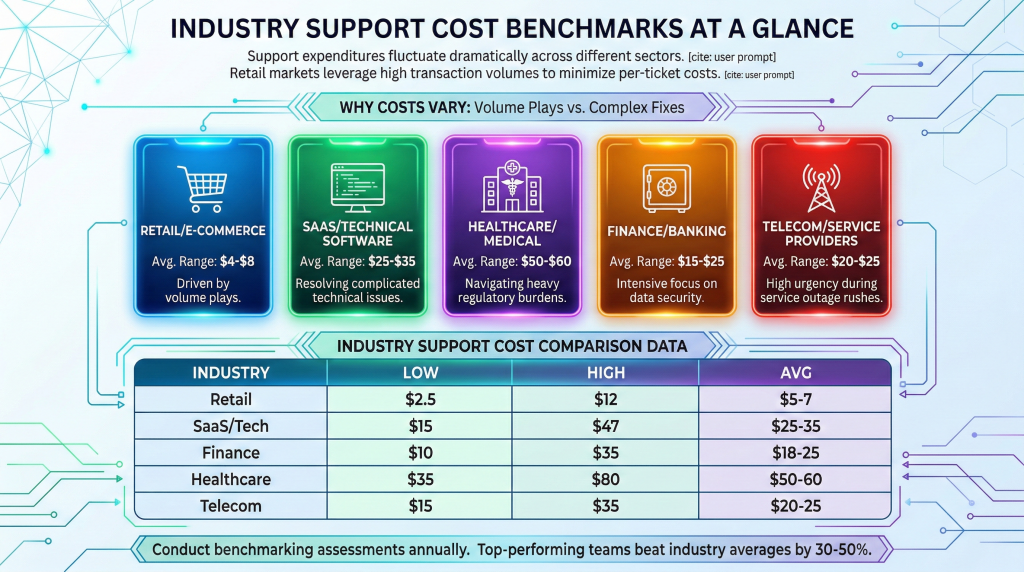
Costs vary wildly by sector. Retail keeps it cheap with volume plays.
Here’s a quick list:
- Retail/e-commerce: $4-8 average.
- SaaS/tech: $25-35, complex fixes.
- Healthcare: $50-60, regulations heavy.
- Finance: $15-25, security focus.
- Telecom: $20-25, outage rushes.
Benchmark your numbers yearly. Top performers beat averages 30-50%.
| Industry | Low | High | Avg |
| Retail | $2.5 | $12 | $5-7 |
| SaaS/Tech | $15 | $47 | $25-35 |
| Finance | $10 | $35 | $18-25 |
| Healthcare | $35 | $80 | $50-60 |
| Telecom | $15 | $35 | $20-25 |
Breaking Down Costs by Channel
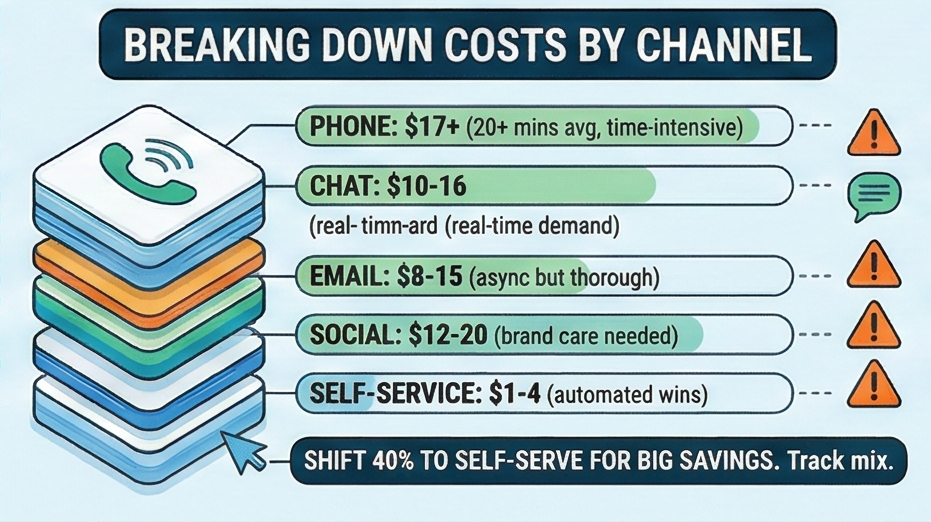
Different channels carry unique price tags. Phone leads at $17-25, time-intensive.
Key channels and costs:
- Phone: $17+, 20+ mins average.
- Chat: $10-16, real-time demand.
- Email: $8-15, async but thorough.
- Self-service: $1-4, automated wins.
- Social: $12-20, brand care needed.
Shift 40% to self-serve for big savings. Track each to optimize mix.
Main Drivers of High Costs
Several factors push numbers up. Agent turnover tops the list at $5k-10k per spot.
Common culprits:
- Long handle times (>10 mins): $2/min extra.
- Weak tools: Double entry wastes 20%.
- No self-service: 30% more tickets.
- Low FCR (<70%): Repeats double cost.
- Overhead creep: Training overlooked.
Fix one, save thousands. Audit quarterly.
10 Strategies to Cut Costs Smartly
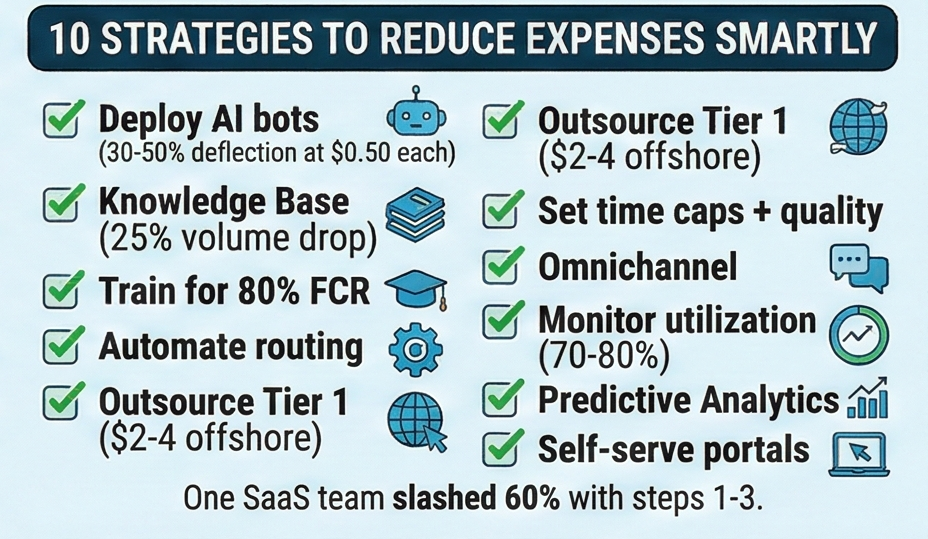
Ready to trim? Try these proven tactics:
- Deploy AI bots: 30-50% deflection at $0.50 each.
- Beef up knowledge base: 25% volume drop.
- Train for 80% FCR: Fewer follow-ups.
- Automate routing: Match skills fast.
- Outsource Tier 1: $2-4 offshore.
- Set time caps with quality checks.
- Go omnichannel: Unified agent views.
- Monitor utilization: Aim 70-80%.
- Predictive analytics: Flag escalations.
- Self-serve portals: Empower users.
One SaaS team slashed 60% with steps 1-3. Start small.
Zendesk excels at automation and reporting, perfect for these tweaks. Freshworks offers easy setups for growing teams.
2026 Trends to Watch
AI evolves fast. Expect 50% bot handling, averages under $6.
Shifts ahead:
- Voice AI mainstream: Matches chat efficiency.
- Predictive routing: 20% faster.
- Hybrid global teams: Best of costs.
- ROI focus: Support as profit center.
Costs fall 25% overall. Adapt now.
Best Tools from Our List
Track with these:
- Zendesk: Full metrics suite.
- Freshworks: Affordable AI flows.
- Zoho Desk: Scalable for SMBs.
- LiveAgent: Multichannel cheap.
They integrate easy, save manual grind. Test fits your stack.
Mistakes That Cost You Big
Avoid these traps:
- Partial costs only: Misses 20%.
- Speed over solve: Repeat hell.
- No audits: Creep unnoticed.
- Outsource blind: Quality crash.
- Burnout ignore: Turnover spike.
Balance keeps you winning.
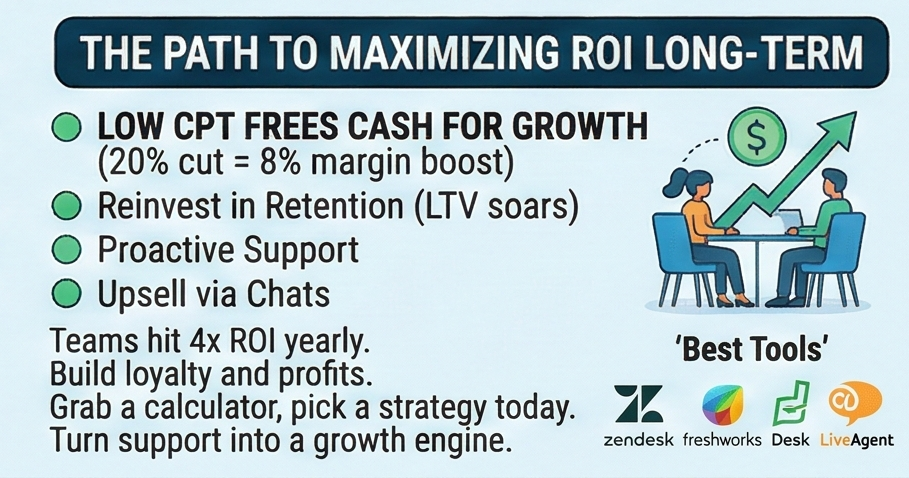
Maximizing ROI Long-Term
Low CPT frees cash for growth. 20% cut equals 8% margin boost.
- Reinvest in retention: LTV soars.
- Proactive support: Fewer tickets.
- Upsell via chats: Revenue add.
Teams hit 4x ROI yearly. Your support builds loyalty and profits.
Wrap Up
Grab a calculator, run your numbers today. Pick two strategies like AI trial or base refresh. Watch costs drop, service shine. Your business grows from there. So there you have it, all the key stats and strategies to get your support cost per ticket under control.
You’ve seen the averages by region, industry, and channel, plus real ways to cut expenses without skimping on service.
The big takeaway? Small tweaks like AI bots or better training deliver massive savings over time.
Your team can turn support from a drain into a growth engine.
Pick one idea from this post and run with it this week. You’ll wonder why you waited so long.


Leave a Comment