You open your laptop, log into your dashboard, and there it is: a wall of charts, graphs, and flashing status indicators. It looks impressive. It looks like you’re running a space station. But when you ask yourself the simple question—which of these deals are actually going to close this month?—the dashboard goes silent.
That is the trap of modern reporting. It is incredibly easy to collect data, but it is surprisingly difficult to turn that data into a story that makes sense. Most sales teams treat reporting like a chore they have to check off at the end of the quarter. They compile spreadsheets, export CSV files, and present slides that everyone forgets five minutes later.
If you want reports that actually help you sell more, you need to change how you build them. It isn’t about tracking every single mouse click or email open. It’s about pulling the right numbers from your CRM and arranging them so you can see where your process is working and where it’s stalling. Let’s look at how to build reports that your team will actually use.
What Actually Matters in a Sales Report?
Before you click a single button in your software, you need to decide what you are looking for. If you try to track everything, you end up tracking nothing. A great sales report should answer three basic questions: How much are we selling? How fast are we selling it? And why are we losing the deals we lose?
To get those answers, you need to understand the mechanics of customer relationship management as a pipeline, not just a digital address book. Your CRM is a living history of your interactions with buyers.
When you run a report, you want to focus on three core areas. First, you’ve got pipeline value—essentially, how much cash is sitting in your active deal pipeline right now. Then there’s velocity, which tracks the speed at which a prospect goes from their initial demo call to signing on the dotted line. And of course, keep an eye on your win rate, which tells you what percentage of your total pipeline actually crosses the finish line as a won deal. If you keep your focus on these three indicators, your dashboards will stay clean and your sales meetings will stay productive.
4 CRM Tools to Build Your Reports (and How to Set Them Up)
Different CRMs handle data in different ways. Some keep things simple and visual, while others allow you to build custom calculated fields for enterprise pipelines. Here is how to navigate the reporting engines in four of the most popular platforms.
1. HubSpot: Simple Reports That Don’t Waste Your Time
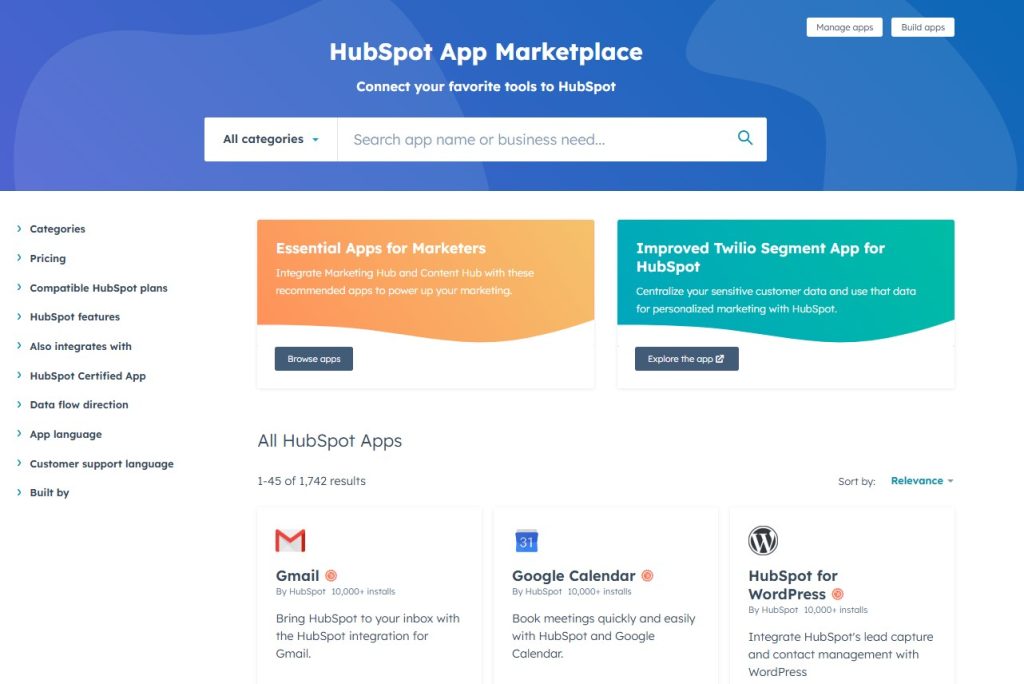
If you hate reading through setup guides just to see how your team is doing, HubSpot is a great starting point. Their custom report builder is a visual playground where you just drag, drop, and watch your charts form.
Where it really stands out is tieing your marketing campaigns directly to closed deals, showing you exactly which ads or emails drove the highest-paying customers.
To build a sales report in HubSpot, start by navigating to the reporting menu on your main home dashboard. Click “Create report” and select the “Single object” builder if you want to look at deal data alone, or choose the “Custom report builder” to blend deal data with contact history.
From there, select your properties. Drag “Deal Stage” and “Amount” into your configuration panel. Choose a bar chart visualization to see how your revenue is distributed across the pipeline. You can save this chart directly to your team dashboard or share it via email with a couple of clicks.


2. Salesforce: The Enterprise Reporting Powerhouse
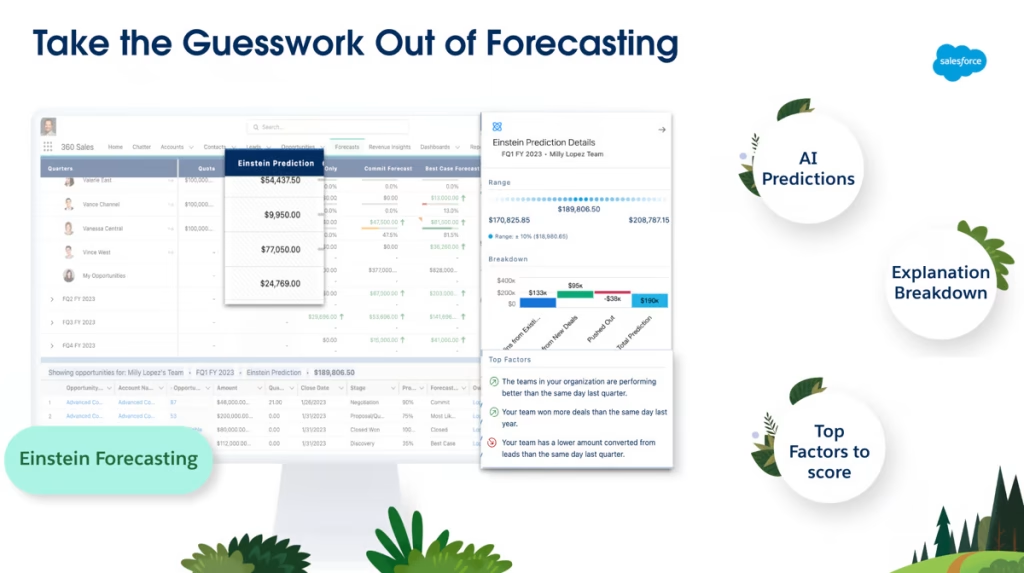
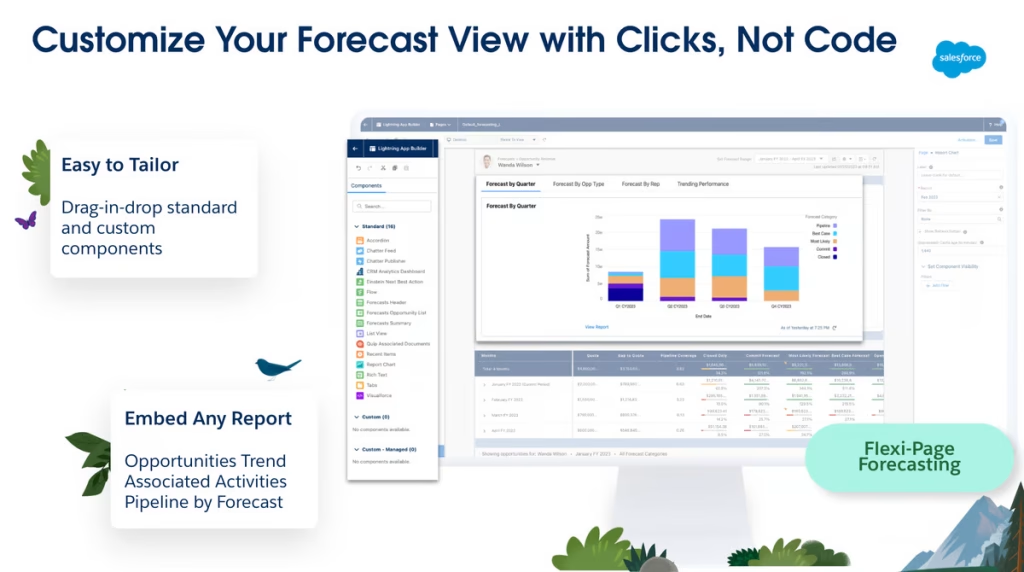
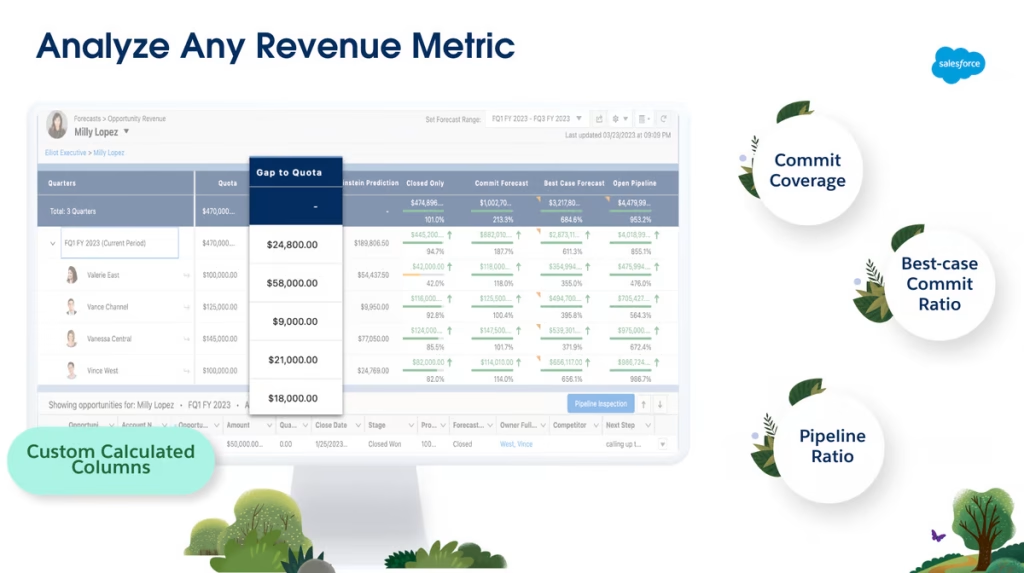
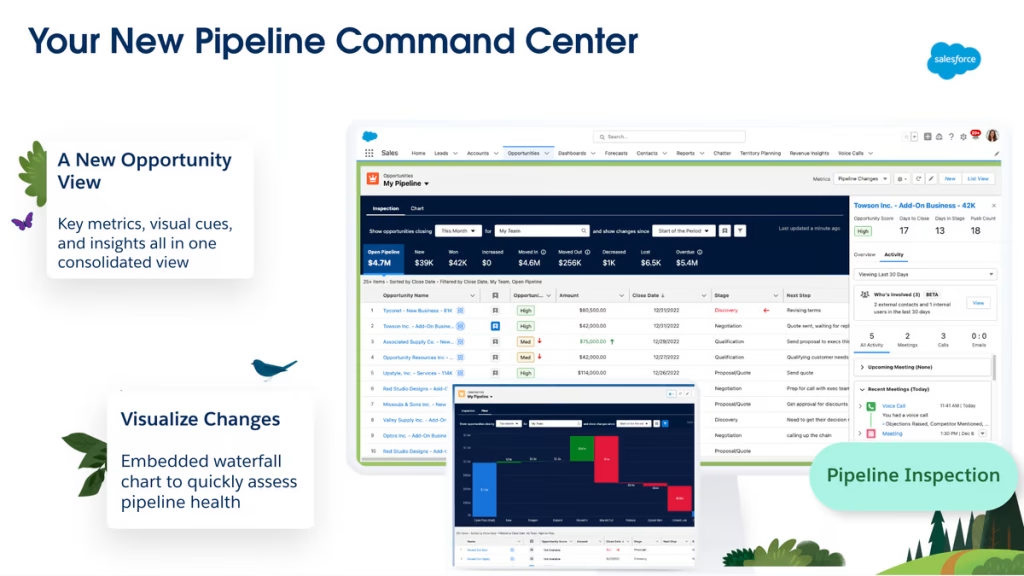
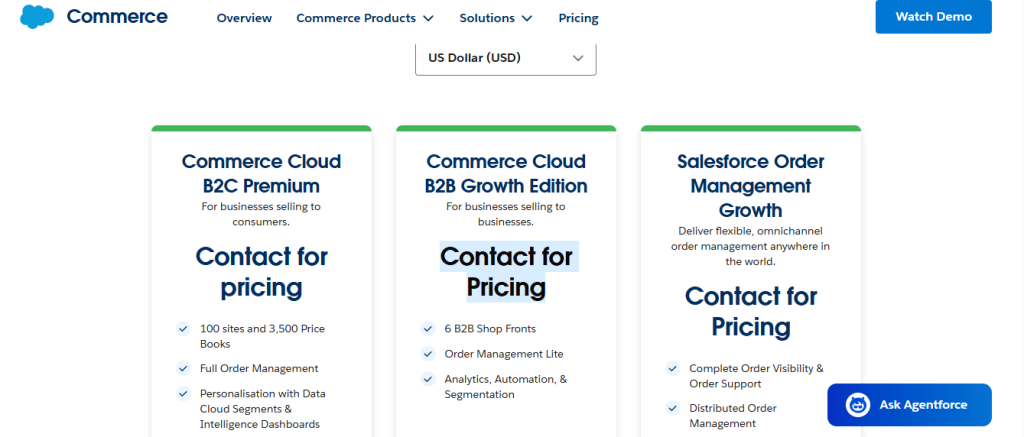
If your business has a complex sales process with multiple territories, product lines, and custom pricing structures, Salesforce is the gold standard. It is not the easiest system to learn, but its reporting engine is incredibly deep.
Salesforce treats everything as an object, allowing you to run cross-object reports that connect accounts, opportunities, leads, and custom variables in a single view.
To get started, head to the “Reports” tab in your navigation bar and click “New Report.” Select the report type you need—for most sales pipelines, “Opportunities” is the category you want.
Inside the builder, use the outline panel to group your opportunities by “Stage” and “Owner.” This groups your deals logically so you can see which reps are holding the most value. Toggle the matrix option if you prefer a detailed spreadsheet-style breakdown, then hit run to populate the graph with fresh numbers.

3. EngageBay: All-in-One Reporting for Startups
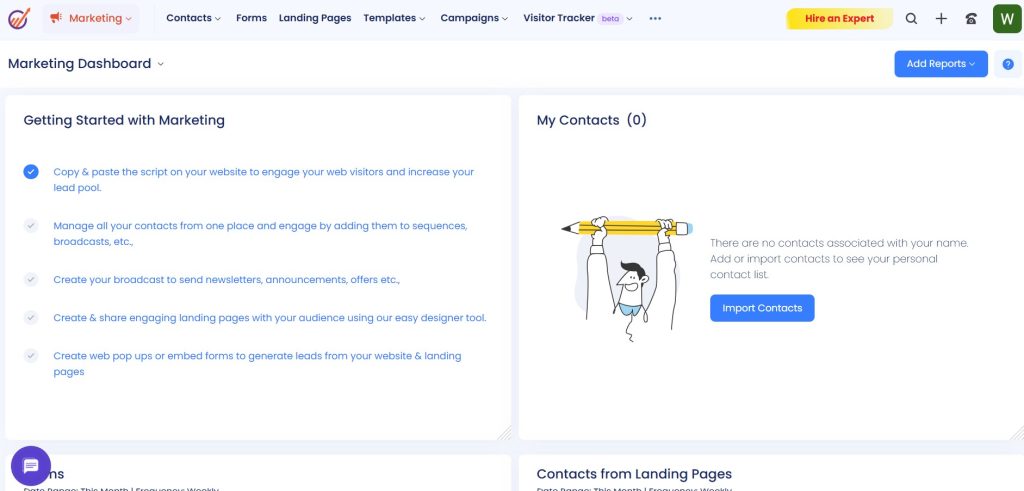
Most scaling businesses don’t want to fight with enterprise-grade setups. They need a single, straightforward dashboard that links sales tracking, email marketing, and helpdesk metrics without the overhead. That is where EngageBay shines.
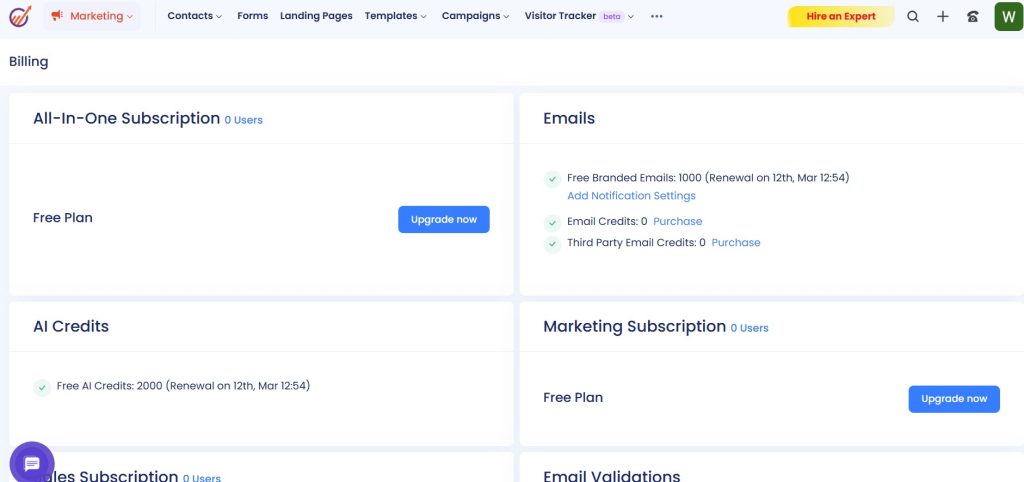
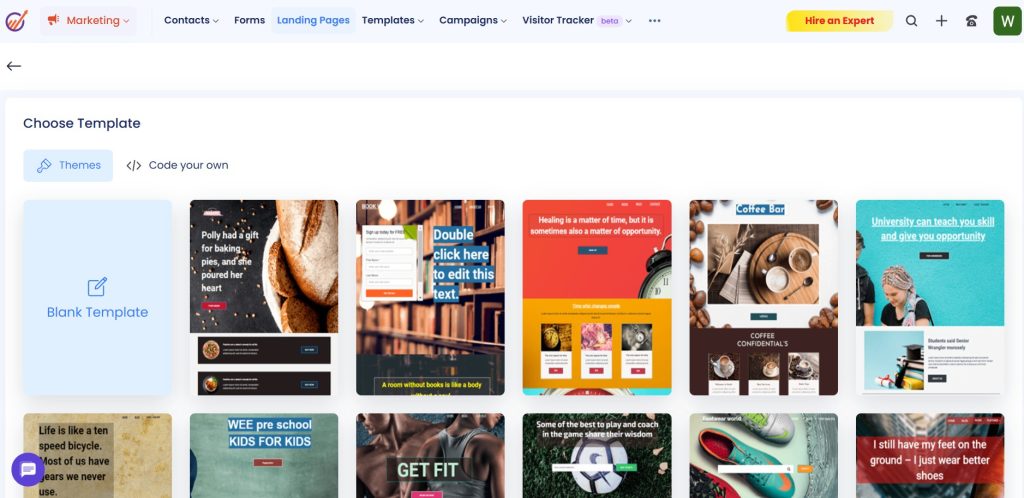
It offers a clean interface that lets you track your pipeline without paying for features you’ll never use. To run reports in EngageBay, click on the “Sales” module and select the “Deals” dashboard. This view shows your active pipeline stages as a kanban board, giving you an instant visual report of your active deals.
For a deeper look, head to the “Reports” section on the left sidebar. Click “Add Report,” choose “Deal Report,” and select your parameters. EngageBay lets you group reports by created date or closed date, which is incredibly useful when you want to compare this month’s closed deals against the same period last year.
4. Streak: The Inbox-Integrated Pipeline Tracker
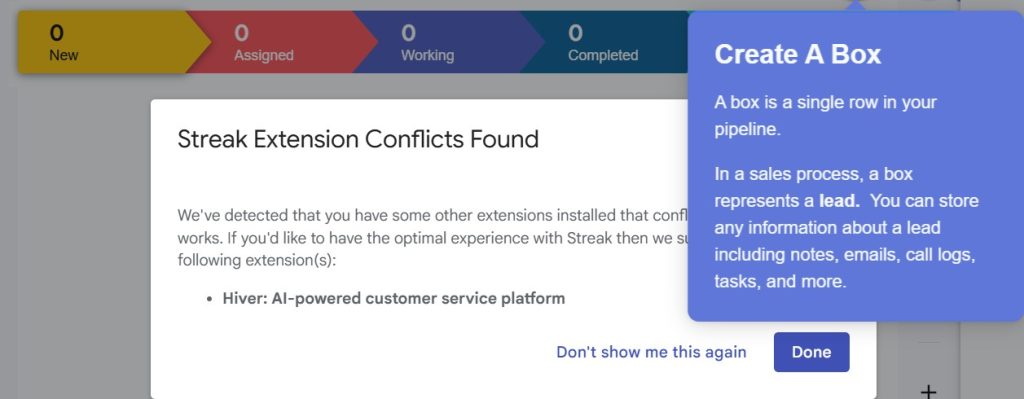
If your team lives inside email and hates logging into a separate CRM every day, Streak is a lifesaver. It turns your Gmail inbox into a fully functional CRM pipeline, allowing you to track leads, add notes, and move deals directly from your email threads.
Because it sits inside Gmail, the setup is incredibly fast, and you don’t have to worry about manual data entry for email conversations.
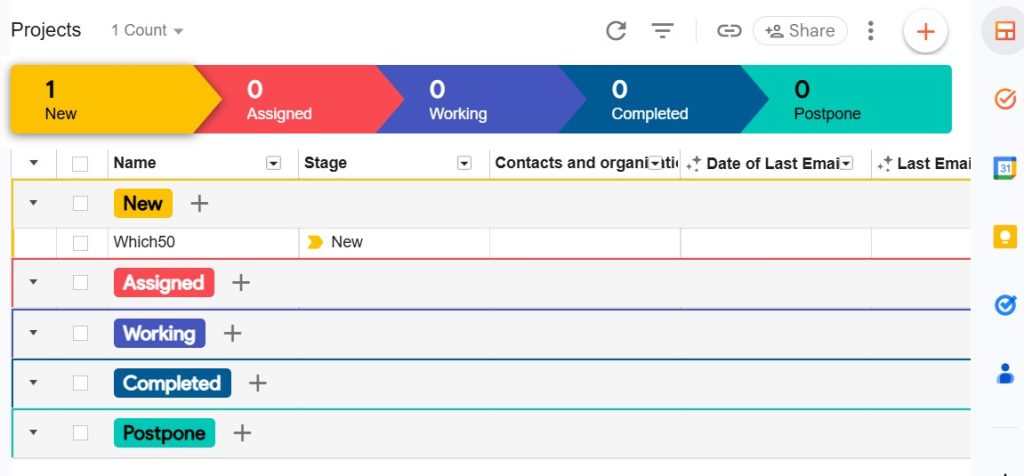
To generate reports in Streak, open your pipeline from the Gmail sidebar and click on the “Reports” icon at the top of the sheet.
Streak will automatically generate a set of charts showing your pipeline funnel, deal source distribution, and pipeline velocity. You can see how many days a deal spends in “Introduction” before moving to “Negotiation,” helping you spot bottlenecks in your response times without leaving your inbox.

3 Rules for Reporting that Actually Helps You Sell
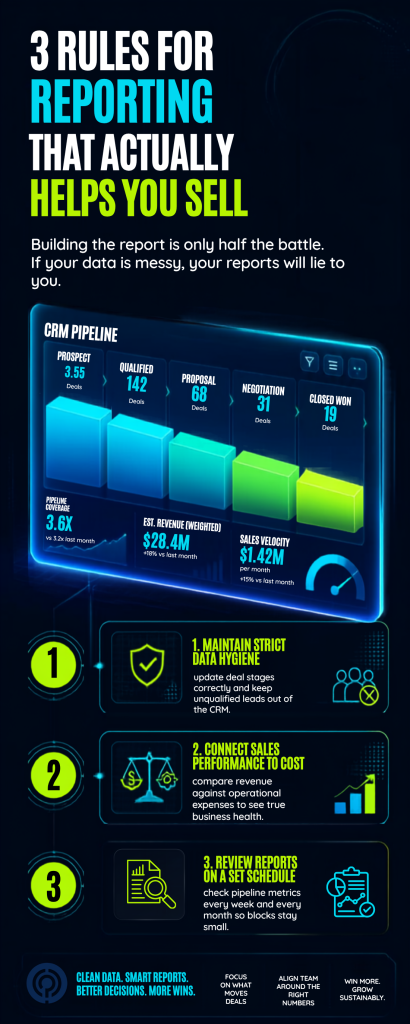
Building the report is only half the battle. If your data is messy, your reports will lie to you. Follow these three rules to keep your metrics clean and useful:
1. Maintain Strict Data Hygiene
Your reports are only as good as the information your sales reps put into the CRM. If reps are lazy about updating deal stages, your pipeline value will be completely wrong. Set clear rules for when a deal must be moved from one stage to the next.
If you want to ensure that only serious buyers enter your pipeline in the first place, check out this guide on how to qualify leads for your sales team. Keeping unqualified leads out of your CRM ensures your win rates and revenue forecasts stay realistic.
2. Connect Sales Performance to Cost
Revenue is a great metric, but it only tells half the story. To see the true health of your business, you need to compare the revenue your sales team is closing against the expenses it takes to run your operations.
Comparing your deal pipeline with what you’re actually spending on operations shows you what is actually hitting your bank account. Take a look at this breakdown on implementing real-time expense reporting and analytics to connect the dots between raw sales numbers and operational costs.
3. Review Reports on a Set Schedule
A dashboard that you only look at when you are in trouble is useless. Build a habit of reviewing your pipeline metrics at the same time every week.
Use your Monday morning standup to look at pipeline velocity and active deals. Use your monthly review to look at win rates and overall revenue. Keeping a consistent rhythm ensures that minor pipeline blocks don’t turn into major quarterly misses.
Keep Your Dashboards Focused
At the end of the day, the best sales report is the one that leads to action. You do not need a complex web of thirty different charts to run a successful sales team. Start with the basics: track your pipeline value, watch how fast your deals are moving, and make sure your team keeps the CRM updated. Find a CRM that fits your daily workflow, keep your filters clean, and use the data to make decisions instead of just storing numbers.



Leave a Comment