Stop flying blind.
Every single day, your support team handles dozens, maybe hundreds, of customer queries. Tickets get opened, chats get closed, and customers leave either thrilled or ready to post a scathing review on LinkedIn. But if you are managing a team based entirely on “gut feelings” and vague vibes, you are losing money.
Let’s be honest: tracking support isn’t about micromanaging every single second your team spends on a ticket. It’s about knowing exactly where your post-sale experience is bleeding out so you can patch the holes before your customers walk out the door.
Here is how you actually build a data-driven customer support machine without turning your team into mindless support robots.
How to Track Customer Support Performance Metrics
Setting up a tracking system sounds boring, but it is the foundation of everything. If you don’t track your numbers systematically, you are just guessing.
First, you need the right dashboard infrastructure. Don’t try to track everything via a giant, messy spreadsheet. It doesn’t scale, someone will eventually break the formulas, and it gives you zero real-time insights. You want tools that live-track interactions. Platforms like Zendesk pull all these communication threads together natively, giving you actual hard numbers on ticket volume, resolution times, and channel performance right out of the box. If you want something that integrates beautifully with a broader suite, Zoho Desk or Freshworks can serve as your central command center, ensuring no conversation slips through the cracks. increase customer loyalty and revenue. This is why companies that actively track support performance often outperform those that do not.
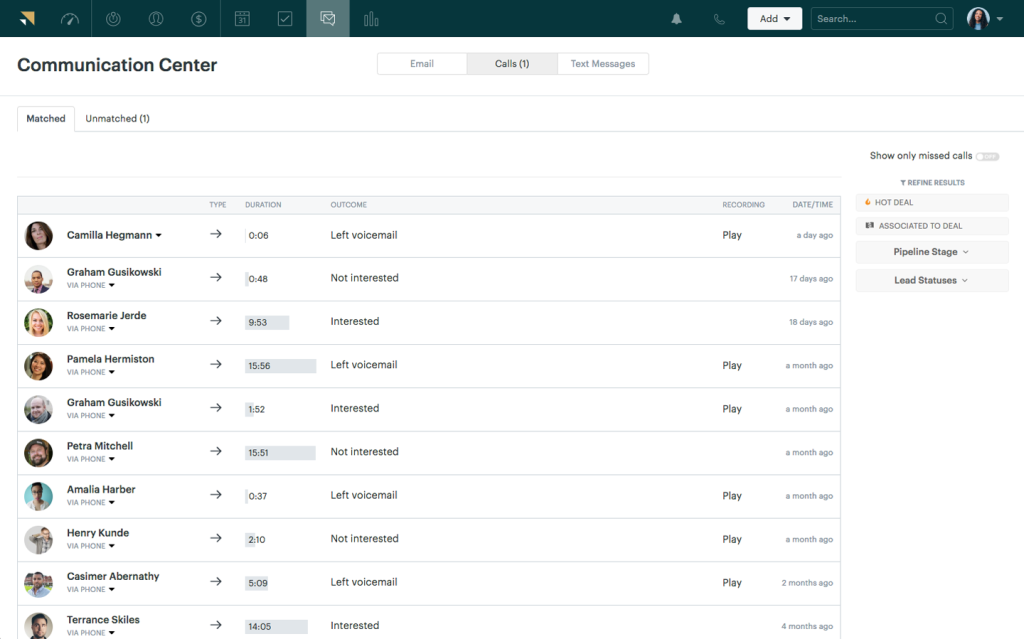
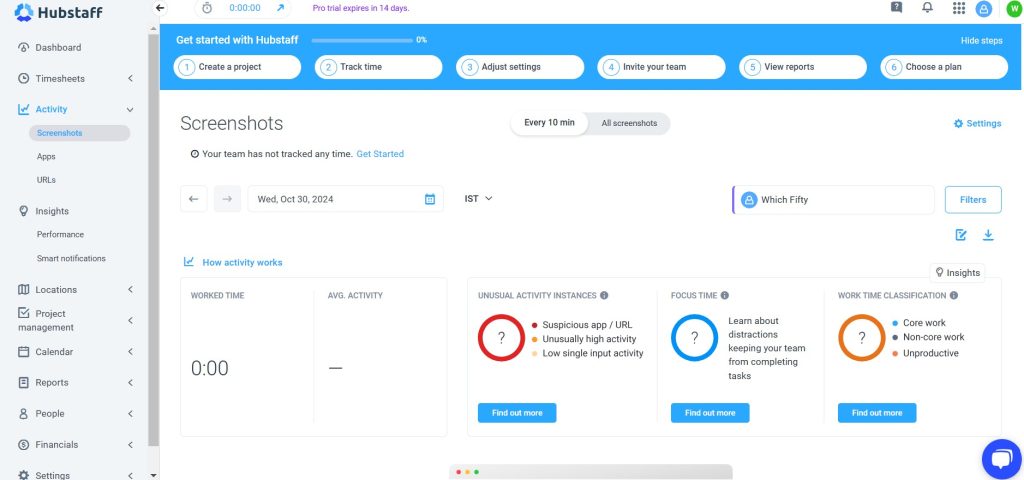
Second, connect internal performance with external output. It’s one thing to see how fast a ticket closes, but do you know how long it actually took your team to complete the work behind the scenes? This is critical for remote or hybrid teams. Using a dedicated tracking tool like Hubstaff helps map out exactly where the hours go, letting you see if an agent is swamped with complex technical troubleshooting or just buried under bad internal processes. Alternatively, team monitoring options like Time doctor or Clockify offer deep visibility into operational efficiency.
Once your software stack is talking to each other, you need a daily operational routine. Pick three core numbers for your managers to review every morning. Everything else is noise.
Key Customer Support Metrics You Should Track
If you look at fifty different metrics at once, you look at nothing. Let’s skip the fluff and focus exclusively on the high-impact metrics that tell you the absolute truth about your operation.
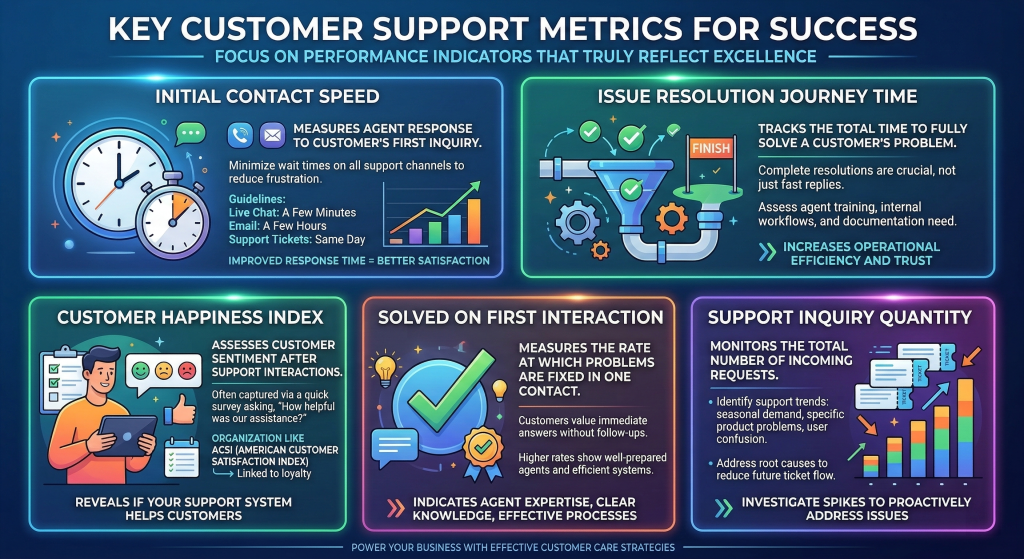
Customer Satisfaction Score (CSAT)
This is the ultimate reality check. It’s the simple survey sent right after a ticket closes asking, “How would you rate the support you received?” The math is simple: count your positive responses, divide them by your total responses, and multiply by 100 to get a clean percentage. Aim for something above 80%. But here’s the thing: CSAT only tells part of the story. People usually only reply when they are incredibly happy or completely furious. Pay attention to the written feedback attached to the low scores. That’s where the real gold is buried.
First Response Time (FRT)
How long does a customer sit there staring at their screen waiting for a human to acknowledge their existence? Speed matters. A lot. It impacts your retention numbers more than almost anything else. If a customer has a broken system, an hour feels like a lifetime. Try breaking this down by channel. Your email FRT might realistically be a couple of hours, but if your live chat FRT is more than two minutes, you have a massive leak in your funnel.
Average Resolution Time
Getting back to them quickly is great, but did you actually fix the issue? This metric tracks the entire lifecycle of a ticket from the second it is opened to the exact moment it is marked resolved. If your FRT is fast but your average resolution time is dragging out over three days, your team is likely playing endless rounds of email tag. It means your front-line agents don’t have the authority or the technical training to solve problems on the spot. They are just passing the buck.
Ticket Volume & Backlog
Keep an eye on the raw number of incoming conversations. Watch for trends. Are tickets spiking every single Tuesday after a product deployment? If your incoming ticket volume consistently outpaces your resolution rate, your backlog grows. It’s brutal. A growing backlog means your team is burning out. Fast.
Improving Customer Support Based on Metrics
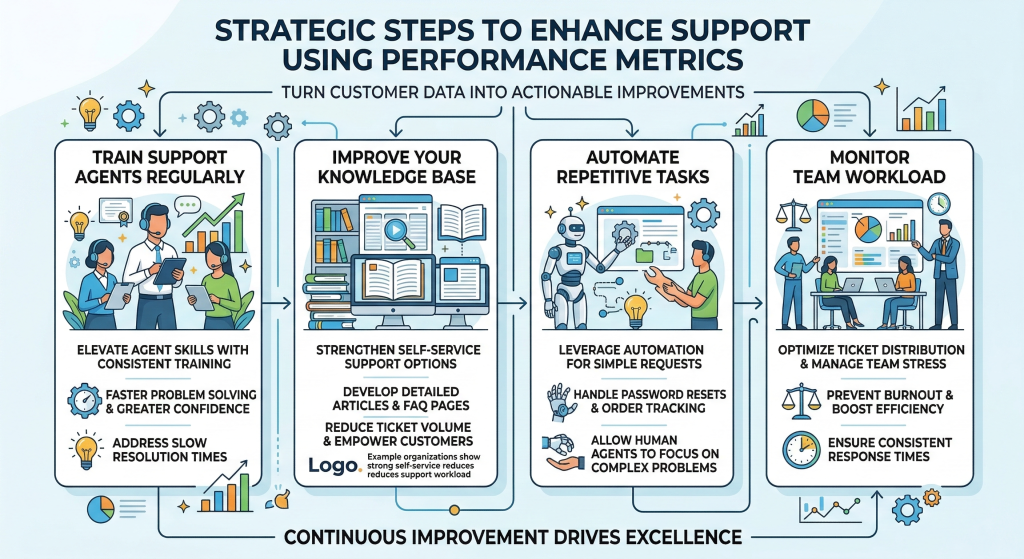
Data is completely useless if you just stare at it on a dashboard and go back to doing things the old way. You have to turn those numbers into operational changes.
Look at what your metrics are trying to tell you. If your response times are spiking while customer satisfaction drops, it is a clear sign your queue management is broken. Instead of making angry customers wait in the main line, implement a quick triage layer. Have a dedicated tier of agents knock out simple issues like password resets within minutes, keeping the main deck clear for deeper technical problems.
When your metrics show that resolution times are dragging out over days, look closely at your internal policy. Do your agents have to ask permission from a senior manager just to issue a $20 credit or approve a return? If yes, you are intentionally building bottlenecks. Stop doing this. Give your team the autonomy to make customers happy on the very first interaction. The saved labor costs easily outweigh the occasional small refund.
Finally, analyze your ticket arrival patterns by the hour. If you have a massive surge of inquiries hitting at 4:00 PM every weekday but your heaviest staffing shifts are in the morning, your scheduling is broken. Look closer at the data, align your workforce to mirror customer demand, and beef up your public self-serve FAQs so customers can solve problems without needing you at all.
Wrap Up
At the end of the day, your customer support metrics are a reflection of your company’s operational health. High response times and failing CSAT scores are rarely just an “agent performance” issue. They are structural signals telling you that your software stack is disconnected, your documentation is out of date, or your team is vastly understaffed during peak hours. Stop treating your support department like a costly burden. Treat it like a data lab. Listen to what the numbers are saying, fix the underlying systemic friction, and give your team the tools they need to succeed. Your customers will thank you for it.



Leave a Comment