If your site feels slow, it usually is. And your visitors notice faster than you think. A slow CMS setup does not just annoy people. It quietly hurts SEO, conversions, and trust.
This blog is a practical look at CMS performance benchmarks and the most useful page speed statistics to know in 2026. You will learn what “good speed” looks like, how Core Web Vitals fit in, and why different CMS platforms can feel fast or slow depending on how they are built. Along the way, you will see relatable tool names that help you measure and fix speed problems.
What “Fast” Means in 2026
A lot of people still ask, “What is a good page load time?” The simplest answer is: aim for around 2 seconds or less for key pages if you can. Some studies call 2 seconds an industry benchmark for load time. At the same time, average load times across the web can still be much slower on mobile than desktop, which shows why speed work is not optional anymore.
Also, speed is not one single number. A page can “load” but still feel slow if users cannot interact with it. That is why Google’s Core Web Vitals matter.
The 3 Core Web Vitals Benchmarks (Targets)
Google’s current Core Web Vitals are LCP, INP, and CLS. Here are the targets most teams aim for:
- Largest Contentful Paint (LCP): under 2.5 seconds is considered good
- Interaction to Next Paint (INP): under 200 milliseconds is considered good
- Cumulative Layout Shift (CLS): under 0.1 is considered good
These are not random. They map to what users feel:
- LCP = “Did the page show the main content quickly?”
- INP = “Does the page respond quickly when I click or tap?”
- CLS = “Did the layout jump around while loading?”
Page Speed Statistics That Explain Why This Matters
Speed talk can feel abstract until you look at real numbers.
Here are a few stats that make it real:
- Average page load time is often reported around 2.5 seconds on desktop and 8.6 seconds on mobile in 2025 studies, showing mobile performance is still the big struggle.
- Ecommerce sites that load in 1 second can see much higher conversion rates compared with slower sites, and conversion rates drop heavily as load time increases.
- A 1-second delay has been widely associated with lower conversions, and some sources quote a 7% drop as a rule-of-thumb impact.
- Even small speed gains can matter. One case study cited by Cloudflare notes that a 100 ms improvement led to a measurable conversion lift for a brand (Mobify).
- Google data often cited in performance discussions shows bounce probability increases as load time rises from 1 to 3 seconds.
The takeaway is simple: shaving off even half a second can be worth real money.
CMS Performance Benchmarks: What You Can Compare (And What You Shouldn’t)
When people say “CMS benchmarks,” they usually mean one of these:
- Backend speed (server processing time, cached vs uncached)
- Frontend speed (how fast the page renders for users)
- Real-user performance (field data from actual visitors)
You should compare CMS platforms carefully because “WordPress vs Drupal vs Shopify” depends heavily on:
- Hosting quality
- Theme complexity
- Plugin load
- Caching setup
- CDN setup
- Image and font choices
- Third-party scripts
Still, there are interesting benchmark signals out there.
WordPress vs Drupal (A Useful Example)
One benchmark-style comparison reported that a warm-cached Drupal page was dramatically faster than an equivalently configured WordPress setup without caching, highlighting how caching and architecture choices impact backend timing. The real lesson is not “Drupal always wins.” The real lesson is your caching strategy matters more than your CMS brand name.
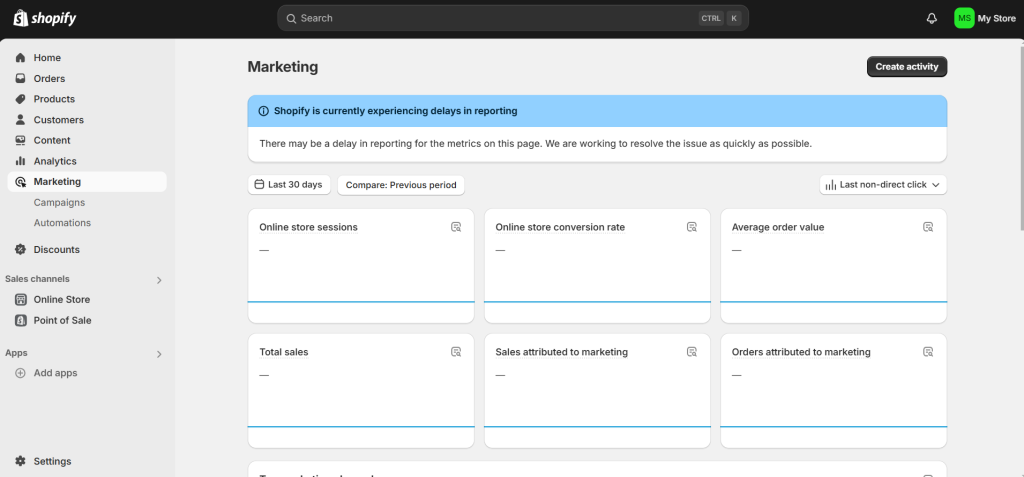
Shopify Performance Signals
Some CMS platforms control more of the stack, and that can help. For example, one comparative article cites Shopify performance claims around TTFB and render speed, suggesting strong baseline performance compared with other ecommerce platforms. Again, themes and apps can still slow things down, but the infrastructure baseline is often strong.
Core Web Vitals by CMS (A Real-World Lens)
One industry article discussing CWV performance by CMS reported that WordPress had a lower percentage of “good” CWV scores than some other platforms, while Shopify scored notably high on “good” CWV in that dataset. This is a helpful reminder that CMS defaults and typical site builds influence outcomes, even before you touch optimization.
The Metrics That Matter Most (And Why)
To make this actionable, focus on a few performance metrics that connect to business results.
Real-User Metrics (Best for Truth)
These are measured from real visitors:
- Core Web Vitals (LCP, INP, CLS)
- TTFB (Time to First Byte): how fast your server responds (not a Core Web Vital, but still important)
- Bounce rate by device: mobile bounce spikes often point to mobile speed issues
Tools that help here: Google Search Console, PageSpeed Insights, CrUX, DebugBear, SpeedCurve.
Lab Metrics (Best for Debugging)
These come from test environments:
- Total page size
- Number of requests
- JavaScript execution time
- Render blocking resources
Tools that help here: Lighthouse, WebPageTest, GTmetrix.
A smart workflow is: use real-user data to pick priorities, then use lab tools to fix the causes.
Why CMS Sites Get Slow (Common Causes)
Most slow sites are not slow for one reason. They are slow because of stacks of small issues.
Here are the biggest culprits seen across CMS builds:
- Bloated themes with huge CSS and JavaScript bundles
- Too many plugins/apps/extensions
- Unoptimized images (wrong dimensions, heavy formats)
- Too many third-party scripts (ads, widgets, chat tools)
- Weak hosting or missing server-side caching
- No CDN for global delivery
- Too many fonts or heavy font files
- Poor database hygiene (especially on older CMS installs)
If you want a relatable mental image: your CMS is a kitchen. Your plugins are appliances. A few help. Too many blow the fuse.
Practical Benchmarks You Can Use
These targets work well as “healthy defaults” for most marketing sites and content sites. Not every site will hit all of them, but they give you something clear to chase.
Page Speed Targets (Practical)
- LCP: under 2.5 seconds
- INP: under 200 ms
- CLS: under 0.1
- TTFB: under 800 ms (a common practical target for most sites)
- Fully loaded time: under 3 seconds (aim lower for ecommerce)
Page Weight Targets (Practical)
- Keep total page size close to 1 MB to 2 MB for key landing pages if possible.
- Keep requests under 50 to 75 for key pages if possible.
These “weight” targets are not official benchmarks from Google, but they work well in the real world because heavy pages rarely feel fast on mobile.
CMS-Specific Speed Tips (That Don’t Feel Like Tech Soup)
Here is what usually makes the biggest difference.
WordPress

WordPress can be fast, but it is easy to make it slow.
Best moves:
- Use a lightweight theme.
- Limit plugins to what you truly need.
- Add caching and asset optimization.
- Use a CDN.
- Compress and resize images.
Relatable tools people use: WP Rocket, Perfmatters, LiteSpeed Cache, ShortPixel, Imagify, Cloudflare.
Drupal

Drupal is often strong for performance when caching is set up correctly, and it has built-in caching features that many teams lean on.
Best moves:
- Make sure internal caching is enabled.
- Use Redis or Memcached for object caching.
- Use a CDN for static assets.
Relatable tools: Varnish, Redis, Cloudflare, New Relic.
Shopify
Shopify gives you a solid baseline, but themes and apps can add weight fast.
Best moves:
- Audit apps and remove the ones that do not earn their keep.
- Use modern image formats and correct sizing.
- Keep your theme lean and avoid heavy sliders.
Relatable tools: Shopify Analyzer tools, TinyIMG, Cloudflare (for some setups).
Headless CMS (Contentful, Strapi, Sanity)
Headless can be very fast because you control the frontend, but it can also be slow if your frontend is heavy.
Best moves:
- Use static generation where possible (Next.js, Gatsby).
- Cache API responses.
- Keep third-party scripts under control.
Relatable tools: Vercel, Netlify, Cloudflare, Next.js Analytics.
A Simple Speed Audit Checklist (Do This First)
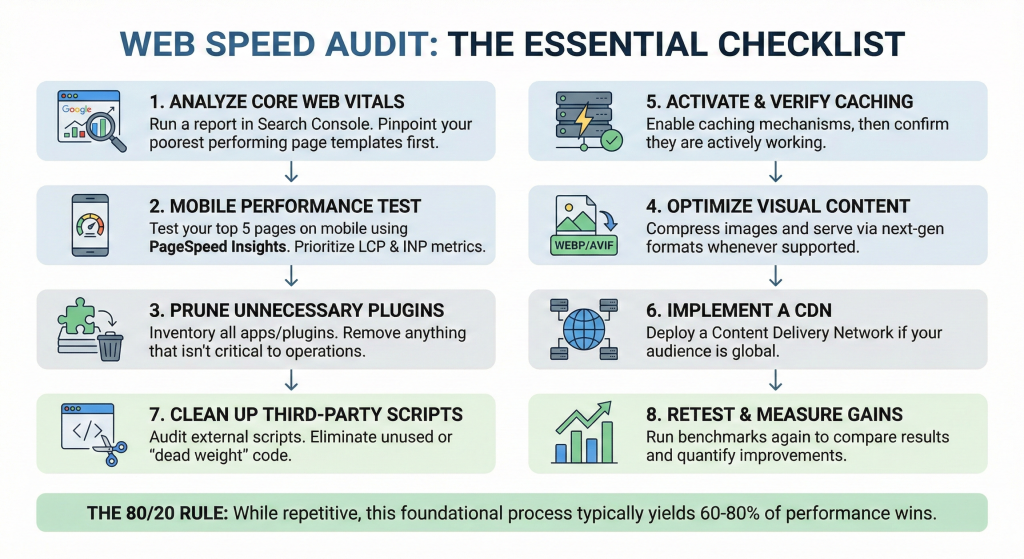
If you only do one thing after reading this, do this checklist.
- Run a Core Web Vitals report in Search Console and identify your worst templates first.
- Test your top 5 pages on mobile using PageSpeed Insights (focus on LCP and INP).
- List every plugin/app and remove anything not essential.
- Compress images and serve next-gen formats where possible.
- Turn on caching, then verify it is actually working.
- Add a CDN if you have visitors outside your server region.
- Audit third-party scripts and cut the dead weight.
- Retest and compare results.
This process is boring, but it works. And it usually gets you 60 to 80% of the wins.
How to Talk About Speed With Non-Technical Stakeholders
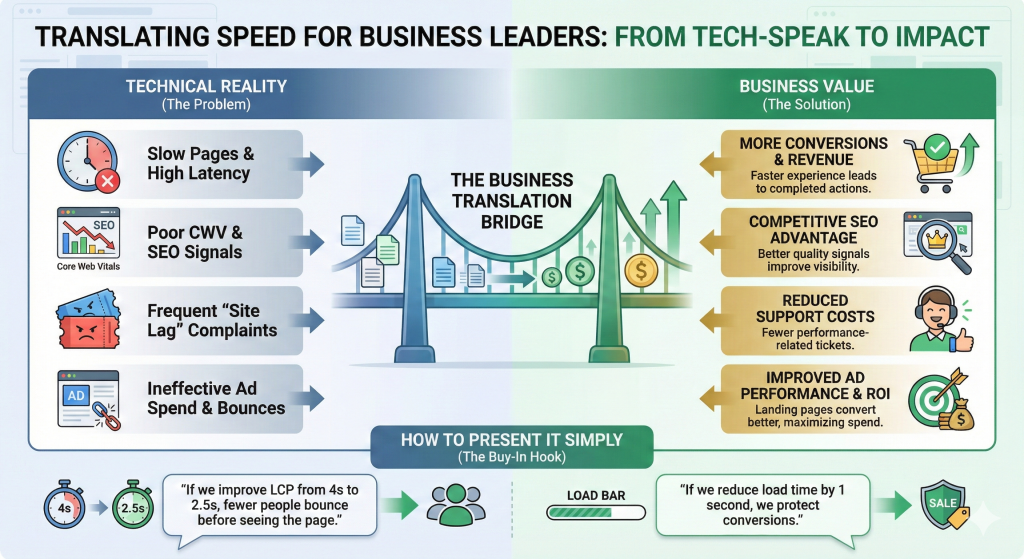
Speed projects often die because they sound like tech-only problems. So here is how to explain it in business language.
- Faster pages = more conversions
- Faster pages = better SEO competitiveness (Core Web Vitals are a quality signal)
- Faster pages = fewer support tickets about “site not working”
- Faster pages = better paid ad performance because landing pages convert better
A simple way to present it is:
- “If we improve LCP from 4 seconds to 2.5 seconds, fewer people bounce before seeing the page.”
- “If we reduce load time by 1 second, we protect conversions.”
That gets buy-in.
Wrap Up
CMS performance is not magic. It is the result of choices: hosting, themes, plugins, scripts, images, and caching. The benchmarks that matter most in 2026 are still the Core Web Vitals targets: LCP under 2.5 seconds, INP under 200 ms, and CLS under 0.1. And the stats are clear that speed impacts real business outcomes, from bounce rate to conversion rate.
If you want a simple path forward, start with your top pages, test on mobile, cut unnecessary weight, and fix the biggest bottlenecks first. You do not need perfection. You just need steady improvement. Your visitors will feel it, Google will notice it, and your results will follow.


Leave a Comment