You know that feeling when you finally hit send on a massive email campaign? You’ve spent hours obsessing over the copy. You tweaked the subject line five different times. You even swapped out the header image because it felt just a little too corporate.
Then, you sit back and wait. You refresh the dashboard. Nothing. You refresh again ten minutes later. A trickle of opens.
It’s incredibly frustrating. You are leaving thousands of dollars on the table if you are blindly sending emails and hoping they stick. If you want to actually grow your revenue and build an audience that actively looks for your name in their inbox, you need to understand exactly what your data is telling you.
Email marketing is not dead. It is not even dying. But the way we measure success has completely shifted. If you are still looking at your reporting dashboard the same way you did three years ago, you are making decisions based on flawed data. I am going to show you exactly how to analyze your open rates and click-through rates the right way, so you can stop guessing and start driving real conversions.
Why Your Email Metrics Matter More Than Ever
Let’s get one thing straight. You aren’t writing emails just to feel productive. Every unread message represents a lost opportunity to connect, educate, or sell.
A lot of marketers get distracted by vanity metrics on social media. They obsess over likes and shares, but they ignore the single most profitable channel they own: their email list. According to leading industry insights, the return on investment for email is staggeringly high, provided you actually know how to steer the ship. You can check out some fascinating broader perspectives on this from the experts over at Email marketing to see why retaining attention in the inbox is absolutely critical.
But here is the hard truth. Your list naturally decays over time. People change jobs, abandon old email addresses, or simply lose interest. If you are not aggressively monitoring your performance metrics, you will end up repeatedly sending pitches into a black hole. Worse, internet service providers like Gmail and Yahoo will notice that your subscribers are ignoring you, and they will quietly route your future campaigns straight to the spam folder.
Tracking your open rates and click-through rates tells you exactly where the friction is. An open rate tells you if your initial hook worked. A click-through rate tells you if your offer was actually compelling. Analyzing these two numbers in tandem gives you a crystal-clear roadmap of what you need to fix.
The Truth About Open Rates (And Why Apple Changed Everything)
If you think your open rate is 45 percent, I have some bad news for you. It probably isn’t.
A few years ago, Apple introduced Mail Privacy Protection. Essentially, if a subscriber uses Apple Mail, Apple pre-loads the email content on their own proxy servers before the user ever opens it. To your marketing software, this registers as an instant “open.” Suddenly, everyone’s open rates skyrocketed overnight. It felt great for the ego, but it absolutely ruined the accuracy of the metric.
So, how do you analyze open rates when the data is artificially inflated? You have to look at the trend line, not the absolute number.
If your average open rate hovers around 35 percent for six months, and then suddenly drops to 15 percent on a new product launch campaign, you know you have a major problem. The absolute number might be fuzzy, but the dramatic drop is real. It means your subject line was weak, or you landed in the promotions tab.
You also need reliable infrastructure to parse out these nuances. When you use robust platforms, they do a lot of the heavy lifting for you by filtering out obvious bot opens. For example, if you review your setup via Mailchimp you will notice they have adapted their reporting to give you a clearer picture of real human engagement versus machine-generated noise.

When analyzing opens, focus on the segments that matter. Compare how your highly engaged buyers open your emails versus new subscribers. If your best customers stop opening your emails, you need to trigger a re-engagement sequence immediately to win back their attention before they churn completely.
Click-Through Rate: The Ultimate Metric of Intent
While open rates give you a pulse, your click-through rate is the actual heartbeat of your campaign.
If they do not click, they do not buy. It is that simple. The click-through rate measures the percentage of people who clicked a link in your email out of the total number of people who successfully received it.
This is where the rubber meets the road. Getting someone to open an email just requires a bit of curiosity. Getting them to click requires genuine intent. They have to read your copy, decide that your offer is worth their precious time, and take a physical action to learn more.
When I audit a client’s email strategy, the CTR is the very first thing I look at. A high open rate paired with a terrible click-through rate is a classic bait-and-switch. It means you wrote a killer subject line, but the content inside the email completely failed to deliver on the promise.
You can track this effortlessly if you are using advanced automation. For instance, setting up event tracking within active campaign allows you to see exactly which specific links are driving the most action, whether it is a text link buried in the opening paragraph or the massive button at the bottom of the page.

Always aim to optimize for clicks. If you are currently sitting at a 1 percent click-through rate, your primary goal for the next quarter should be pushing that to 2 percent. Doubling your CTR essentially doubles your website traffic from email, without you having to spend a single extra penny on advertising.
How to Calculate and Benchmark Your Performance
You cannot improve what you do not measure accurately. Let’s break down the basic math.
To find your click-through rate, you take the total number of unique clicks, divide it by the number of delivered emails, and multiply that by 100. Most software platforms do this for you natively, but you need to understand the underlying mechanics so you aren’t completely reliant on a dashboard that might be misconfigured.
But what is a “good” number? This is the most common question I get. The reality is that benchmarks vary wildly by industry. A daily newsletter for real estate agents is going to have vastly different metrics than a monthly promotional blast for an e-commerce shoe brand.
As a rough baseline, you generally want to see unique open rates above 20 percent and click-through rates hovering around 2 to 3 percent. But again, these are just averages. You can dig into more specific industry benchmarks by reading the breakdown at Email Marketing which provides a great perspective on realistic goal setting based on company size.
Instead of stressing over industry averages, benchmark against yourself. Look at your performance over the last 90 days. Calculate your own averages. Then, try to beat them every single week.

If you run an e-commerce store, the way you measure success is deeply tied to revenue per recipient. Platforms designed specifically for retail, which you can explore at Klaviyo will often prioritize metrics that show you exactly how much cash a specific click generated, rather than just telling you that someone clicked a random link. That is the exact level of granular analysis you need to strive for.
Stop Guessing and Start Optimizing: 5 Tactics That Actually Work
Now that you know how to read the numbers, you need to know how to move them. Staring at a declining chart does not fix the problem. You need an aggressive strategy to turn things around quickly. Here is exactly what you should do next.
Clean Your List Aggressively
Stop holding onto inactive subscribers. If someone hasn’t opened an email in six months, they are dead weight. They are dragging down your sender reputation and ruining your metrics. Run a sunset flow. Send them one final, highly compelling offer. If they ignore it, delete them. Yes, it hurts to see your total subscriber count drop, but a smaller list of highly engaged buyers is infinitely more profitable than a massive list of ghosts.
Nail the Subject Line and Preview Text Combo
Your subject line is the headline, but your preview text is the sub-headline. Most marketers completely ignore the preview text, leaving it to pull in random text like “View this email in your browser.” That is a massive waste of prime real estate. Treat the preview text as a direct continuation of your subject line. Use it to build urgency or resolve a curiosity gap so the reader feels compelled to open.
Make the Call to Action Massive and Singular
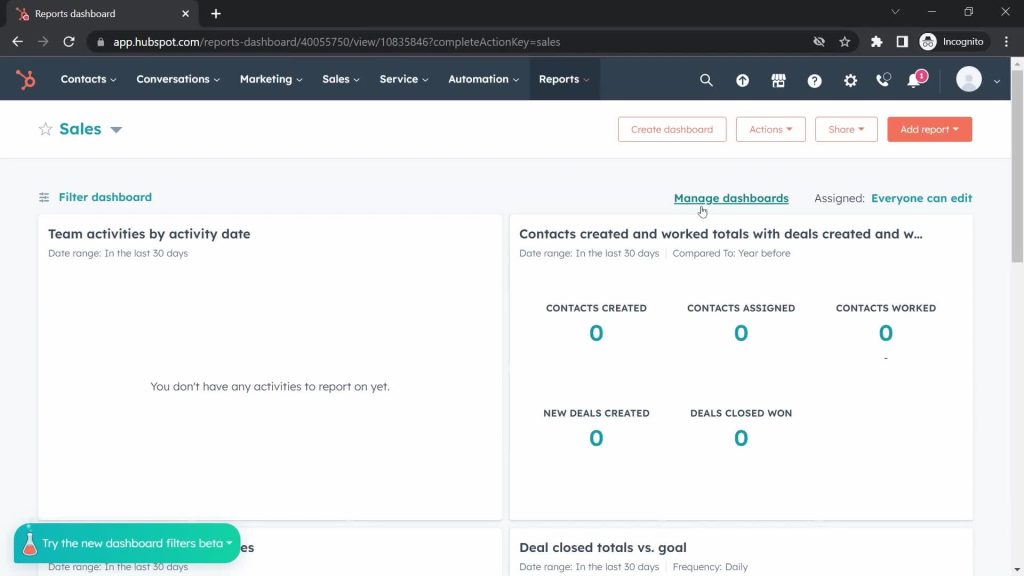
Confusion kills conversions. If you put seven different links in your email asking the reader to read a blog post, follow you on Twitter, buy a product, and listen to a podcast, they will do absolutely nothing. Pick one primary goal per email. If you manage your sales pipeline through hubspot you know that focusing a lead on a single, clear next step dramatically increases the likelihood of them booking a call or making a purchase. Make the button stand out. Use contrasting colors. Make it impossible to miss.
Segment Like a Control Freak
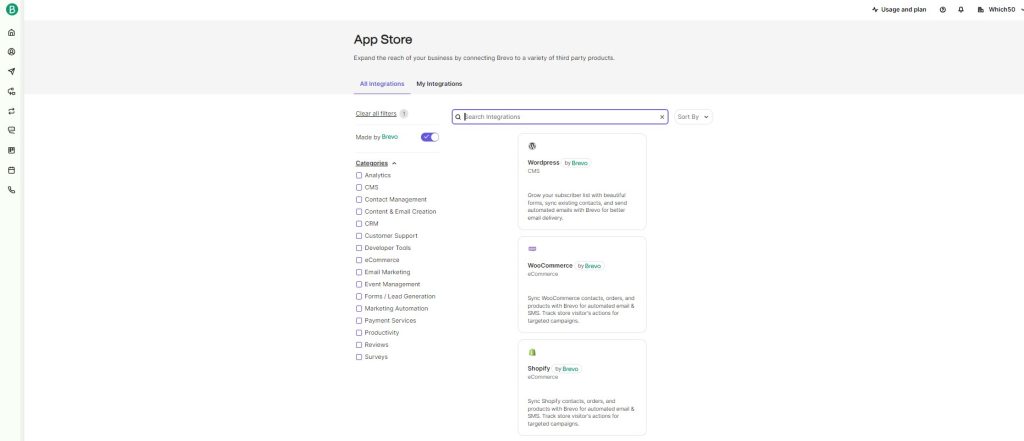
Batch-and-blast is a lazy strategy. You cannot send the exact same message to a VIP customer who spent ten thousand dollars with you last year and a new lead who just downloaded a free PDF yesterday. They have completely different needs. Break your audience down based on their past behavior. If you are using a tool properly configured for this, like the one found at brevo you can easily create custom segments for past purchasers, cart abandoners, and high-intent browsers. Targeted messages get higher open rates and massively higher click rates.
A/B Test the Boring Stuff
Everyone loves to test crazy new design layouts, but the biggest wins usually come from testing the boring elements. Test sending on a Tuesday morning versus a Thursday afternoon. Test plain text emails against highly designed HTML templates. Test a button that says “Buy Now” versus one that says “See the Details.” Let the data tell you what your audience actually prefers, rather than relying on your own gut feeling.
The Revenue-First Way to Read Your Reports
At the end of the day, opens and clicks are proxy metrics. They are leading indicators of success, but they are not the finish line.
You cannot pay your mortgage with a 40 percent open rate. You pay it with actual revenue. When you are analyzing your email metrics, you must connect the dots all the way to the final transaction.
If an email generates 500 clicks but zero dollars in sales, the campaign was a failure. The email did its job by getting the click, but there was a massive disconnect on the landing page. Perhaps the price was too high, the offer was confusing, or the checkout process was broken on mobile devices.
Conversely, I have seen ugly, plain-text emails with a measly 1 percent click-through rate generate tens of thousands of USD in a matter of hours because the few people who did click were hyper-qualified and ready to buy right then and there.
Stop looking at your email reports in a vacuum. Tie every single metric back to your bottom line. Look at the revenue per email sent. Look at the lifetime value of subscribers who came through specific lead magnets. When you shift your focus from chasing clicks to chasing conversions, your entire marketing strategy becomes infinitely sharper and far more profitable.
Conclusion
Analyzing your email metrics doesn’t have to be overwhelming. You just need to cut through the noise. Accept that open rates are a directional trend, not an absolute truth. Treat your click-through rate as the ultimate test of your copywriting and offer strength. Stop worrying about what other companies in your industry are doing, and start relentlessly testing your own campaigns to beat your personal best. Scrub your lists, simplify your calls to action, and always follow the click all the way to the cash register. Do that, and you will turn your email list into the most predictable revenue engine your business has ever seen.



Leave a Comment