
Resolution time is the number most support teams track but few actually benchmark against anything meaningful. You know your average handle time. You might even celebrate when it drops. But without context—what’s typical for your industry, your ticket volume, and your channel mix—a number on its own doesn’t tell you whether your team is performing well or just performing consistently at the wrong level.
Helpdesk benchmarks exist to close that gap. They give you a reference point for what good looks like at different scales, across different support channels, and under different SLA commitments. More importantly, they help you identify where time is actually being lost—whether that’s first-response delays, repeat contacts from unresolved issues, or tickets that sit untouched in a queue while agents handle easier work first.
This guide covers what resolution time benchmarks actually mean, where the real bottlenecks tend to be, and which tools give you the reporting depth to track your own numbers with enough precision to act on them.
What Resolution Time Benchmarks Actually Tell You
Resolution time—how long a ticket takes to go from open to closed—is one metric, but it’s made up of several contributing factors that benchmarks rarely break apart cleanly.
- First response time is how long a customer waits before any agent touches their ticket. Industry research consistently puts the acceptable threshold at under one hour for email and under five minutes for live chat. Many support teams are well outside that window without realizing it because first response isn’t tracked separately from resolution.
- Full resolution time varies significantly by channel and complexity. For simple tier-one queries over chat or email, under four hours is competitive. Complex issues that get kicked up to senior engineering or product teams usually stretch to anywhere between twenty-four and seventy-two hours. Enterprise support contracts with formal SLAs typically define these thresholds per ticket category rather than applying a single number across the board.
- First contact resolution rate is often more meaningful than resolution speed. A ticket closed in two hours that requires a follow-up from the customer is worse than a ticket closed in six hours that required no follow-up. Benchmarks for FCR generally sit between seventy and seventy-five percent for well-run support operations, with top-tier teams hitting eighty to eighty-five percent.
- Reopened ticket rate tells you how often resolutions don’t actually stick. If more than ten percent of your closed tickets are reopened within seventy-two hours, the resolution process has a quality problem, not a speed problem.
Where Resolution Time Actually Gets Lost
Most resolution time delays don’t happen at the agent level. They happen in the structure around the agent.
Tickets waiting in unassigned queues before being picked up. Agents switching between disconnected tools to find customer history. Pass-offs that force agents to email another department rather than assigning the ticket directly inside the helpdesk. Replies sent without access to the customer’s previous interactions, leading to repetitive context-gathering that the customer has already provided twice.
A meaningful portion of resolution time in most support operations is administrative overhead rather than actual problem-solving. The right tooling eliminates most of it without requiring agents to change how they work.
Tools That Give You Real Resolution Data
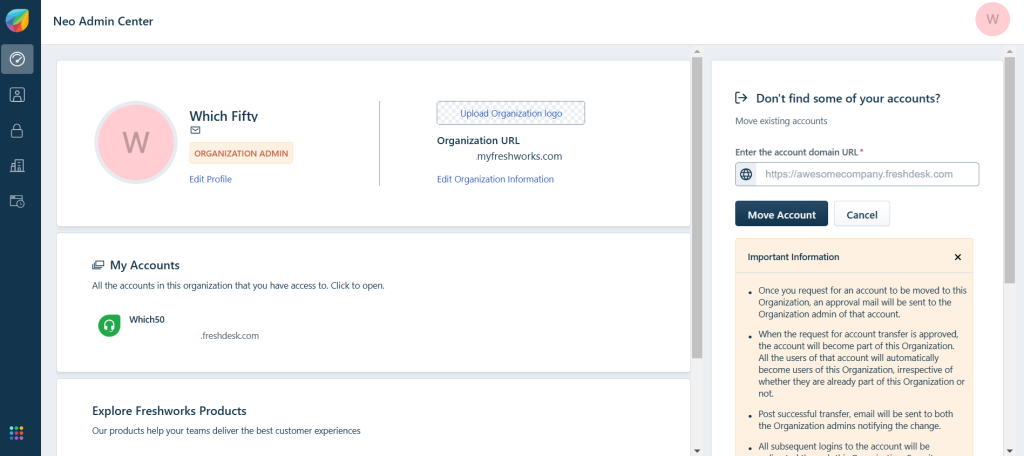
Freshdesk — Best for Growing Teams Tracking SLA Performance
Freshdesk is built to make SLA compliance visible at every level. You set target resolution times per ticket priority, and Freshdesk surfaces which tickets are approaching breach, which have already breached, and which agents are handling the most at-risk queue in real time.
The reporting suite breaks resolution time down by ticket category, channel, and agent so you can see whether email tickets are resolving slower than chat, or whether a specific support tier is consistently overrunning its SLA targets. That level of breakdown is what separates useful benchmarking from vanity metrics.
Zendesk — Best for Mature Support Operations With Custom SLAs
Zendesk handles the complexity of enterprise SLA management as well as any platform in the market. You can define multiple SLA policies for different customer segments—enterprise accounts get four-hour resolution windows while standard accounts get twenty-four hours—and Zendesk tracks compliance against each policy independently.
The Explore reporting tool lets you build custom dashboards that slice resolution time by any dimension you care about: team, ticket type, account tier, or time period. If you’re presenting SLA performance to leadership or clients, Explore produces the kind of granular, visual reports that make the data readable for non-technical stakeholders.
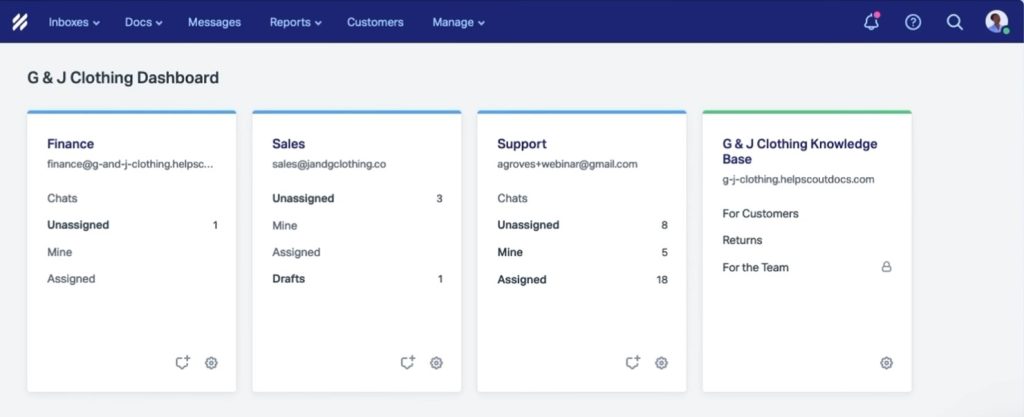
Help Scout — Best for Small Teams Focused on Quality Over Speed
Help Scout takes a different angle on resolution benchmarking. Rather than surface-level ticket metrics, its reporting centers on customer satisfaction and conversation quality alongside resolution time.
The happiness rating system collects post-resolution feedback automatically, so you can correlate fast resolutions with customer satisfaction scores and spot patterns where speed is helping or hurting. For teams where the quality of the resolution matters as much as how quickly it arrived, Help Scout’s reporting reflects that priority.
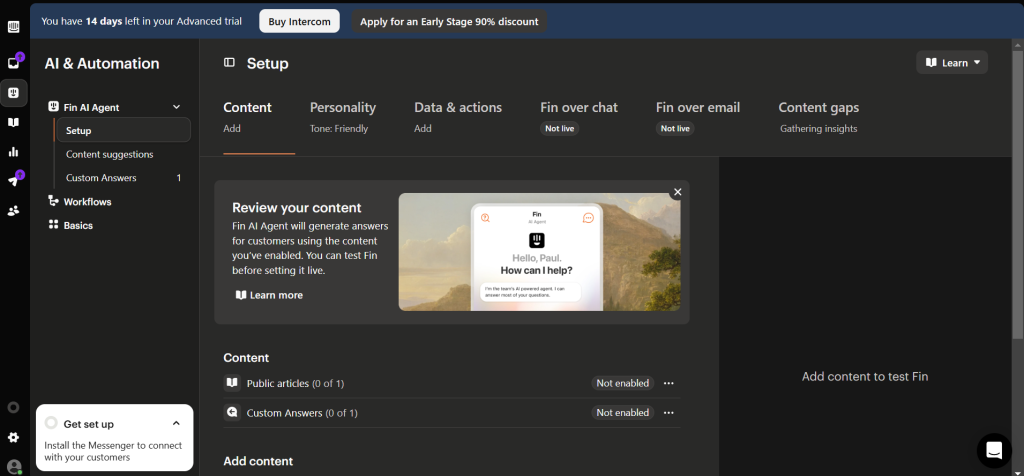
Intercom — Best for Product-Led Teams Tracking In-App Support
Intercom sits closest to the product itself for software companies supporting users inside their own platform. Tickets opened via in-app chat or messenger come with automatic session context—what the user was doing when they reached out, which page they were on, which account tier they belong to—which cuts the context-gathering phase of most support interactions down to near zero.
Shorter context-gathering time translates directly into faster resolution. Intercom’s resolution reports show median handle time per conversation type, which helps teams identify which in-app workflows are generating the most support load and whether those issues could be resolved through better product design rather than more staffing.
Front — Best for High-Volume Shared Inboxes
Front works as a collaborative shared inbox platform that gives support teams real-time visibility over incoming volume. Front’s analytics highlight who is wrapping up conversations fastest, how long requests sit in a shared inbox before someone takes ownership, and which handoffs are dragging down response times.
If you are monitoring support across email, SMS, and social feeds at the same time, Front aggregates your resolution data so you aren’t hunting down metrics across separate software dashboards.
Kayako — Best for Customer History Context
Instead of looking at isolated tickets, Kayako maps the customer’s entire historical journey directly in the sidebar. When an agent opens a ticket, they see past purchase records, previous chat transcripts, and support logs without having to ask the customer to repeat themselves.
That extra context reduces the back-and-forth that inflates resolution time on repeat contacts. Kayako’s reporting shows resolution time broken out by customer segment, which helps teams identify whether their highest-value accounts are getting faster service or waiting longer than lower-tier contacts.

How to Use Benchmarks Without Chasing the Wrong Number
Benchmarks are a starting point, not a target. Using them well means understanding what they’re measuring and what they’re not.
- Segment your resolution data before comparing: A benchmark for chat support doesn’t apply to email, and a benchmark for tier-one queries doesn’t apply to technical escalations. Compare like with like.
- Track first contact resolution alongside speed: Closing tickets fast that reopen a day later inflates your resolution rate while degrading the customer experience. FCR is a better proxy for support quality than handle time alone.
- Identify your floor, not just your average: The average resolution time smooths over outliers. Find out what percentage of tickets take more than forty-eight hours and investigate those specifically rather than trying to improve the mean.
- Review queue assignment logic regularly: If tickets are sitting unassigned for an hour before an agent picks them up, the problem isn’t agent speed—it’s routing. Most of the platforms above have auto-assignment rules that eliminate that delay entirely.
Conclusion
Resolution time benchmarks are most useful when they point you toward a specific process problem rather than a general performance target. A support team that closes tickets in six hours but never gets repeat contacts is performing better than one closing tickets in three hours with a twenty percent reopen rate—and the metrics need to reflect that distinction.
Freshdesk, Zendesk, Help Scout, Intercom, Front, and Kayako each give you the reporting to track your own resolution data with enough granularity to find where time is actually being lost. Use them to benchmark against your own historical performance first, bring in industry comparisons second, and focus improvement efforts on the queue and routing problems that are adding time before an agent even touches the ticket.


Leave a Comment