Ever had a customer abandon your website mid-conversation because your live chat took too long to respond? You’re not alone. In today’s fast-paced digital world, response time is everything when it comes to live chat. Customers expect instant answers, and even a few seconds delay can send them running to your competitor.
The good news? There are clear benchmarks you can follow to keep customers happy and boost conversions. This comprehensive guide breaks down live chat response time benchmarks across industries, explains why speed matters, and gives you actionable steps to improve your performance. Whether you’re running a small e-commerce store or managing enterprise customer support, these numbers will help you set realistic goals and measure success.
Why Does Live Chat Response Time Matters More Than Ever?
Live chat has exploded in popularity. 85% of consumers prefer live chat over phone or email because it’s quick and convenient. But here’s the catch: customers expect responses within seconds.
Research shows that 82% of customers abandon a live chat if they wait more than 12 minutes. That’s right, 12 minutes. Most expect answers in under 2 minutes, and the top performers respond in under 30 seconds.
Slow response times don’t just frustrate customers. They hurt your bottom line. Studies show that every minute of delay costs you 10% more in lost conversions. Fast responses lead to higher customer satisfaction scores, better retention, and more upsells.
Industry Benchmarks: What “Fast” Looks Like
Response time expectations vary by industry, but here are the current benchmarks based on 2025 data:
E-commerce & Retail
- Top performers: 12-30 seconds
- Industry average: 1-2 minutes
- Acceptable: Under 3 minutes
- Critical threshold: Over 5 minutes = 45% abandonment
Retail customers are shopping. They’re comparing prices and ready to buy. Every second counts. Aim for sub-30 second responses during peak hours.
SaaS & Technology
- Top performers: 15-45 seconds
- Industry average: 2-3 minutes
- Acceptable: Under 4 minutes
- Critical threshold: Over 6 minutes = 38% abandonment
Tech customers often have specific technical questions. They expect knowledgeable, quick answers about features, pricing, and integrations.
Financial Services
- Top performers: 30-60 seconds
- Industry average: 2-4 minutes
- Acceptable: Under 5 minutes
- Critical threshold: Over 8 minutes = 52% abandonment
Security concerns and complex products mean slightly longer response times are tolerated, but trust is built through prompt, accurate responses.
Healthcare & Wellness
- Top performers: 20-45 seconds
- Industry average: 1-3 minutes
- Acceptable: Under 4 minutes
- Critical threshold: Over 6 minutes = 40% abandonment
Patients want quick answers about appointments, insurance, and services. Empathy combined with speed wins here.
Travel & Hospitality
- Top performers: 10-25 seconds
- Industry average: 45 seconds – 2 minutes
- Acceptable: Under 3 minutes
- Critical threshold: Over 4 minutes = 50% abandonment
Travelers make split-second decisions. Fast responses about availability, pricing, and policies convert browsers to bookers.
Response Time Distribution: The Full Picture
Here’s how live chats typically break down across all industries:
| Response Time | Percentage of Chats | Customer Satisfaction |
| < 30 seconds | 25% | 98% |
| 30-60 seconds | 35% | 92% |
| 1-2 minutes | 25% | 78% |
| 2-5 minutes | 10% | 55% |
| > 5 minutes | 5% | 28% |
Key takeaway: 60% of chats should respond in under 1 minute to maintain high satisfaction. Anything over 2 minutes puts you in the danger zone.
First Response Time vs. Resolution Time
Don’t confuse first response time (FRT) with average resolution time (ART). These are two different metrics:
- First Response Time (FRT): Time from customer message to your first reply
- Average Resolution Time (ART): Total time to fully resolve the conversation
Benchmarks:
- FRT: 30 seconds – 2 minutes (industry average)
- ART: 5-15 minutes (simple queries), 30+ minutes (complex issues)
FRT builds trust. ART drives satisfaction. Track both.
Peak Hours: When Response Time Matters Most
Your busiest times need your fastest responses. Here’s what the data shows:
| Time of Day | Traffic Volume | Expected FRT | Staffing Need |
| 9-11 AM | High | < 20 seconds | 150% of average |
| 12-2 PM | Very High | < 15 seconds | 200% of average |
| 5-7 PM | High | < 25 seconds | 125% of average |
| Weekends | Medium | < 45 seconds | 75% of average |
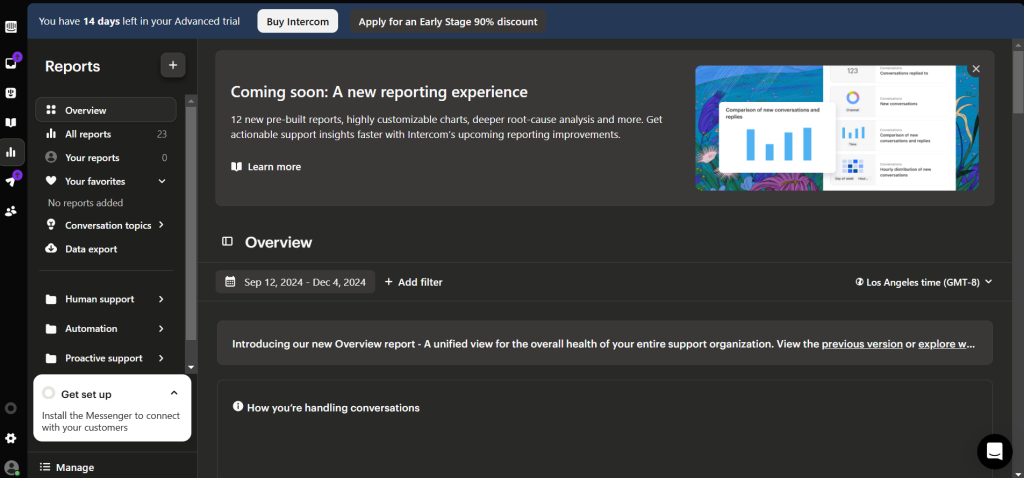
Pro tip: Use predictive staffing based on historical data. Tools like Zendesk and Intercom forecast peak times automatically.
Tools That Track and Improve Response Times
Here are the top platforms with built-in response time tracking:
- Zendesk – Industry-leading analytics with real-time dashboards
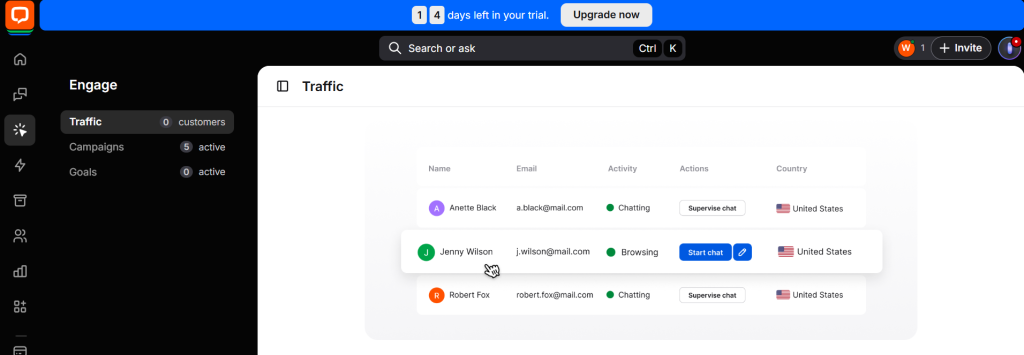
- Intercom – Bot + human hybrid with lightning-fast response tracking
- LiveChat – Simple, affordable, excellent speed metrics
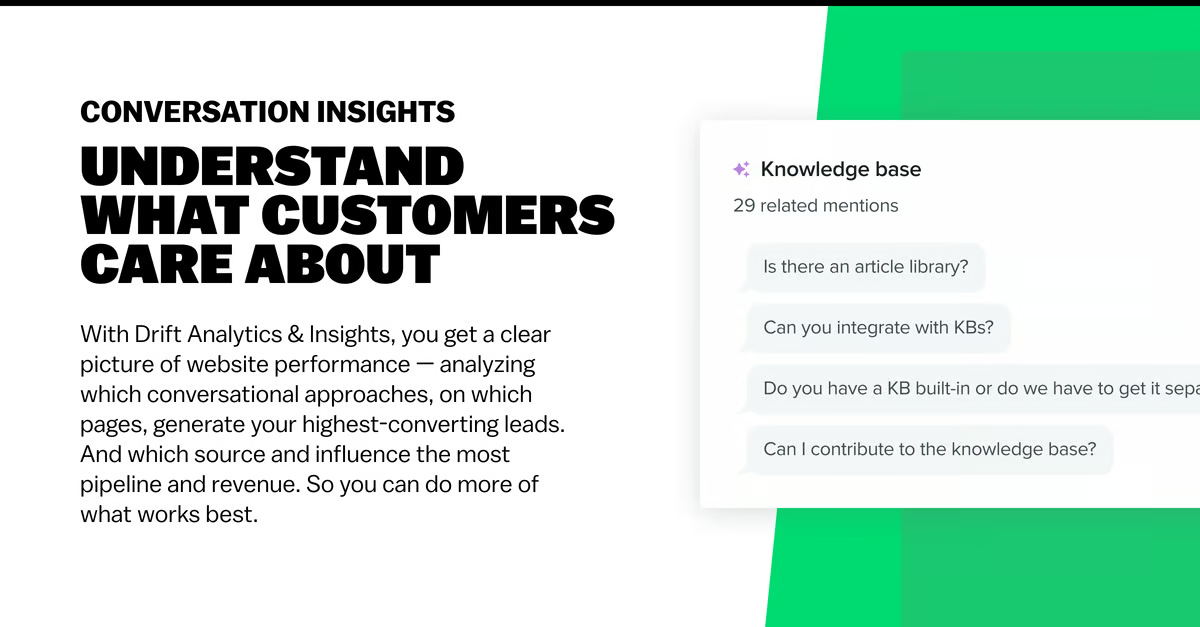
- Drift – Conversational marketing focus with robust timing data
- HubSpot Service Hub – Free tier available, enterprise-grade analytics
Most offer:
- Real-time response time alerts
- Agent performance dashboards
- Automated staffing suggestions
- Customer satisfaction surveys


How to Achieve Top-Tier Response Times
1. Proactive Chat Invitations
Don’t wait for customers to message you. Proactive invitations convert 3x better.
Best Practices:
- Invite after 30-60 seconds on page
- Use behavior triggers (pricing page views, cart abandonment)
- Personalize by page/content
- Limit to 1 invitation per session
2. Smart Bot Routing
82% of simple queries can be handled by bots, freeing humans for complex issues.
Bot Response Benchmarks:
- Greeting + qualification: < 3 seconds
- Simple FAQ answers: < 5 seconds
- Escalation to human: < 10 seconds
3. Agent Training & Scripts
- Typing indicators keep customers engaged during longer responses
- Pre-written responses for common questions (customize before sending)
- Concurrent chat limits (3-5 chats per agent max)
4. Staffing Optimization
Formula: Agents Needed = (Expected Chats/Hour × Target FRT) ÷ 3600
Example: 60 chats/hour, 30-second FRT = 0.5 agents minimum
Scale up 50-100% during peaks.
Advanced Strategies for Enterprise Teams
Geographic Response Teams
Customers expect local response times. Route chats by time zone and language.
Example Structure:
- US East: 6 AM – 10 PM EST
- US West: 6 AM – 10 PM PST
- EMEA: 8 AM – 8 PM CET
- APAC: 9 AM – 9 PM SGT
Skill-Based Routing
| Chat Complexity | Agent Level | Target FRT |
| Simple FAQ | Level 1 | < 20 seconds |
| Technical | Level 2 | < 45 seconds |
| Billing/Urgent | Level 3 | < 60 seconds |
| VIP Customer | Level 4 | < 15 seconds |
AI Response Prediction
Modern tools predict optimal response times based on:
- Customer VIP status
- Issue urgency keywords
- Historical conversation data
- Peak hour multipliers
Measuring Success: Key Metrics to Track
Set up these dashboards weekly:
- First Response Time (FRT) – Primary speed metric
- Resolution Time – Complete conversation duration
- Chat Abandonment Rate – % of chats where customer leaves
- Customer Satisfaction (CSAT) – Post-chat survey score
- Conversion Rate – % of chats leading to sales/demo
- Agent Efficiency – Chats per hour per agent
Target Benchmarks
- FRT: < 45 seconds
- Abandonment: < 5%
- CSAT: > 4.5/5
- Conversion: > 15%
- Agent Efficiency: 4-6 chats/hour
Common Mistakes That Kill Response Times
1. Overstaffing simple hours – Wastes money, underutilizes agents
2. Understaffing peaks – Creates backlog, frustrates customers
3. No proactive invitations – Forces customers to initiate
4. Poor bot-human handoff – Creates delays during escalation
5. Ignoring mobile users – 60% of chats come from mobile
6. Generic responses – Customers detect copy-paste
Future Trends: What’s Next for Live Chat Speed
1. Voice + Chat Hybrids – WhatsApp Business, SMS integration
2. Predictive Staffing AI – Auto-scales agents by forecasted demand
3. Video Chat Integration – Async video responses within chat
4. Multilingual AI Agents – Instant translation + response
5. AR/VR Support – Visual troubleshooting in chat
Implementation Roadmap: Get Started Today
Week 1: Audit Current Performance
- Measure baseline FRT, abandonment, CSAT
- Analyze peak hours and chat volume patterns
- Survey customers about speed expectations
- Benchmark against industry averages
Week 2-4: Quick Wins
- Implement proactive invitations
- Train agents on typing indicators
- Set up basic bot for FAQs
- Optimize peak hour staffing
Month 2-3: Scale Up
- Deploy skill-based routing
- Implement geographic teams
- Add response time alerts
- Launch CSAT surveys
Month 4+: Continuous Improvement
- AI response prediction
- Advanced analytics dashboards
- Video/chat integration
- Benchmark against competitors
Conclusion
Live chat response time isn’t just a metric, it’s your competitive advantage. In a world where customers have unlimited choices and zero patience, speed builds trust, drives conversions, and creates loyal fans.
The benchmarks are clear: aim for under 30 seconds during peaks, under 60 seconds average, and never over 2 minutes. Use the right tools, staff intelligently, and measure relentlessly.
Your customers aren’t just waiting for answers, they’re deciding whether to give you their business. Every second counts. Start today, track your progress weekly, and watch your conversion rates and customer satisfaction soar.
Don’t let slow response times cost you customers. Implement these benchmarks now and turn your live chat into a conversion machine.


Leave a Comment