Open rates tell you whether your subject line earned attention. Click-through rates tell you whether your email earned action. Of the two, click-through rate is the more honest signal — a subscriber who opens but never clicks represents an engaged-looking metric sitting on top of an underperforming campaign.
Understanding what constitutes a strong, average, or weak click-through rate requires more precision than most industry conversations offer. A 2.5% CTR means something entirely different for a B2B technology newsletter than it does for a promotional retail campaign. Benchmarks taken out of their industry context produce misinformed conclusions and, more consequentially, misguided optimization decisions.
This guide compiles the most relevant CTR benchmarks across major industries and campaign types, examines the variables that drive the widest performance gaps between comparable senders, and identifies the specific practices that consistently move CTR in the right direction.
Defining Click-Through Rate Accurately
Click-through rate in email marketing is calculated as the number of unique clicks on any link within an email divided by the total number of emails delivered, expressed as a percentage. Some platforms calculate CTR against emails opened rather than emails delivered — this is typically called click-to-open rate (CTOR) and represents a distinct metric measuring creative effectiveness independent of deliverability and subject line performance.
The distinction matters when benchmarking. Comparing your CTR calculated on delivered emails against a competitor’s CTOR calculated on opened emails produces a meaningless comparison. Confirm which calculation your platform uses before drawing conclusions from any industry benchmark.
Most major platforms — including Mailchimp, Campaign Monitor, and GetResponse — report CTR on delivered emails by default, which is the standard referenced throughout this piece.
Baseline Benchmarks Across Industries
According to Mailchimp’s email marketing benchmarks report, the average click-through rate across all industries sits at approximately 2.62%. That aggregate number, however, conceals enormous variation at the industry level.
The highest-performing sectors by CTR tend to share a common characteristic: subscribers who actively opted in for highly specific, utility-driven content. Government and public sector communications average around 3.99% CTR. Hobbies and interest newsletters — where subscribers enrolled specifically to receive content about a passion — regularly exceed 5%. Religious and community organization emails where list membership is an indication of strong affinity continue to see some of the strongest click engagement of any category.
However, retail and e-commerce campaigns cluster at between 1.2% and 2.1%, a range that reflects the promotional nature of most commercial email programs. Retail list subscribers often receive high volume promotional sends and the inevitable result of saturation is declining engagement over time. B2B technology companies typically land between 2.0% and 3.5%, with significant variance depending on how tightly targeted the list is and whether campaigns are primarily educational or promotional in nature.
Restaurant and food service businesses occupy one of the lower ranges, averaging around 1.0% to 1.5% CTR — partly a function of the browse-don’t-click behavior common to locally-oriented audiences, and partly a reflection of the limited digital action most restaurant emails ask recipients to take.
Healthcare and wellness brands with compliance-appropriate content typically perform above the overall average, reflecting the high intent behind opt-in subscriptions in that category. Financial services content similarly outperforms when it provides genuine utility — rate alerts, account summaries, market commentary — rather than product promotions.
Campaign Type Has As Much Impact As Industry
Segmenting CTR benchmarks by campaign type reveals performance patterns that industry averages alone obscure.
Triggered and behavioral emails consistently outperform batch-and-blast campaigns by a wide margin. Welcome sequences — emails sent immediately after a new subscriber joins a list — achieve some of the highest CTRs in email marketing, frequently between 4% and 8%, simply because the subscriber’s interest is at its highest point the moment they opt in. Cart abandonment sequences drive click rates of 3% to 6% because they reach subscribers at an identifiable high-intent moment.
According to Campaign Monitor’s email benchmark data, automated emails driven by subscriber behavior generate roughly 70% higher open rates and 152% higher click rates than standard newsletter sends. That gap is not incremental. It represents the fundamental difference between sending a message at a time you find convenient and sending a message at a moment the subscriber has demonstrated relevant interest.
Promotional campaigns — price reductions, limited-time offers, product launches — generate highly variable CTR depending on list quality and offer relevance. Well-segmented promotional sends to engaged list segments regularly achieve CTRs above the industry average. The same offer sent to a full, unsegmented list typically performs significantly below it. The content of the offer is less determinative than the match between the offer and the specific recipient receiving it.
Re-engagement campaigns sent to inactive subscribers present their own benchmarking challenge. CTRs on re-engagement sends are almost always lower than active list averages, which is expected — the purpose is to identify which cold subscribers can be revived, not to generate peak engagement. The metric that matters for re-engagement is not raw CTR but the quality of subsequent engagement from subscribers who do click through.
What Actually Drives Click-Through Rate Variation
Among senders in the same industry with similar list sizes, the CTR gap between top-quartile and median performers regularly exceeds two full percentage points. The variables explaining that gap are specific and consistent.
List hygiene and deliverability foundation. CTR is calculated against delivered emails. Senders who allow unengaged subscribers to accumulate on their list — suppressing deliverability as inbox providers interpret low engagement as a signal to route future sends to spam — systematically undercount their CTR because a portion of their emails never reaches the inbox to be clicked. Regular list cleaning, engagement-based suppression of inactive subscribers, and hard bounce removal directly protect CTR performance by ensuring the denominator reflects only genuinely reachable contacts.
Link placement and volume. The position and number of clickable links within an email both affect CTR in predictable ways. Emails with a single clear call to action typically outperform emails with multiple competing links, particularly in shorter campaigns where message focus is an asset. In longer editorial content — newsletters with multiple stories or product roundups — multiple links are appropriate, but the primary CTA should be positioned above the mid-point of the email rather than anchored at the bottom where a significant proportion of readers never scroll.
Mobile rendering. Over 60% of commercial emails are now opened on mobile devices. Tap targets that are too small, link text that runs together on a narrow screen, and CTAs rendered as image-based buttons that fail to load on image-blocking email clients all reduce CTR among mobile openers. Responsive design and plain-text CTA alternatives are standard practice for any list with significant mobile readership.
Sending frequency calibration. There is a well-documented relationship between over-sending and declining CTR. Subscribers who feel over-contacted either disengage — opening without clicking — or unsubscribe, removing themselves from the metric entirely. The optimal frequency is not a universal number; it’s the frequency at which your specific audience continues to find value in each send. Monitoring CTR trend by frequency tier — how does CTR differ among subscribers receiving two sends per week versus four — provides empirical guidance specific to your list.
Tools That Provide the Reporting Depth to Act on Benchmarks


Benchmarks are only useful when you have the platform infrastructure to measure your own performance at sufficient granularity to make meaningful comparisons.
Mailchimp provides per-campaign CTR reporting alongside industry comparison overlays in its Insights dashboard, allowing senders to see how a specific campaign performed relative to the industry average without leaving the platform. The audience segmentation tools enable you to compare CTR over various subscriber cohorts, useful for spotting segments that are consistently outperforming list averages and deserving of more targeted content investment.
Campaign Monitor provides link level click tracking in campaigns so you can see not only the overall CTR but which links within an email are generating the majority of clicks. For senders who distribute longer editorial emails with multiple story links, that granularity shows what content topics get the most engagement, helping to inform future editorial decisions based on actual behaviour data rather than assumptions.
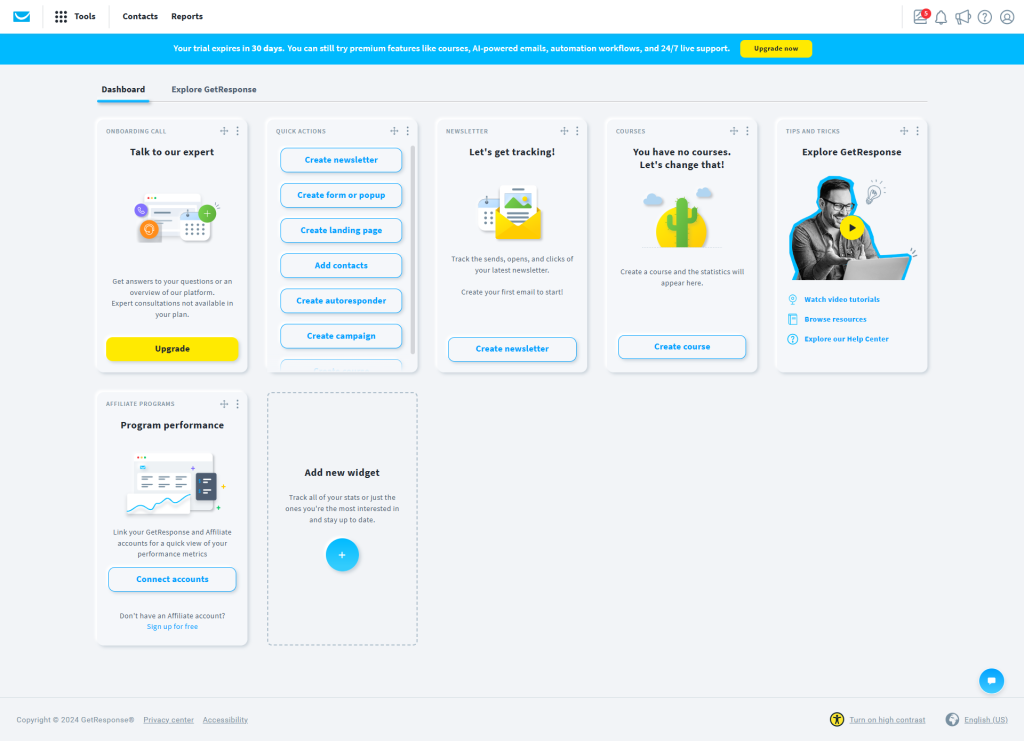
GetResponse combines email analytics with its built-in automation builder, enabling direct A/B testing of email elements — subject lines, CTA placement, send time, content length — with CTR as a measurable outcome. Its heatmap feature visualizes where within an email subscribers are clicking, which is particularly useful for identifying whether subscribers are engaging primarily with the primary CTA or scattered across secondary links in ways that dilute conversion focus.
Realistic Improvement Targets
Benchmarks are a reference point, not a ceiling. For senders below their industry average, the gap typically closes through systematic list hygiene, behavioral segmentation, and send frequency calibration rather than content overhauls.
A sender with a 1.5% CTR in a 2.5% average industry can realistically target a 2.0% to 2.3% CTR within two to three months by suppressing contacts who haven’t engaged in 90 days, shifting at least 30% of email volume to behaviorally triggered sends, and conducting a single A/B test per month on a key campaign element. Each of those actions is operational rather than creative, and each has documented positive impact on CTR across the published literature.
Our guide on personalization in email marketing covers the segmentation and behavioral trigger strategies that most consistently lift CTR for senders already operating at or near their industry benchmark and looking to move into top-quartile performance.
Conclusion
Click-through rate is a performance signal that rewards specificity — in the benchmarks you use for comparison, in the segments you measure performance across, and in the optimization actions you take in response. An industry average CTR applied without context produces an incomplete picture. The same metric applied within the right industry, campaign type, and audience segment points clearly toward where the gap is and what closes it.



Leave a Comment