Let’s be honest. Most customer support dashboards are a total crime scene of vanity metrics.
You open up your reporting tool, see a sea of green checkboxes, and celebrate speedy response times or high ticket counts. Management hands out virtual gold stars, and everyone goes home feeling victorious.
Then you look at churn. It’s spiking. Customers are canceling subscriptions, leaving furious reviews, and jumping ship to your direct competitors.
What happened? You measured the wrong stuff.
Tracking every single metric under the sun doesn’t make your support team world-class—it just makes them exhausted. When you measure everything, you care about nothing. If you want to build a support operation that retains users and drives real revenue, throw out the clutter. Focus strictly on data that paints an honest picture.
Why Customer Support Metrics Matter?
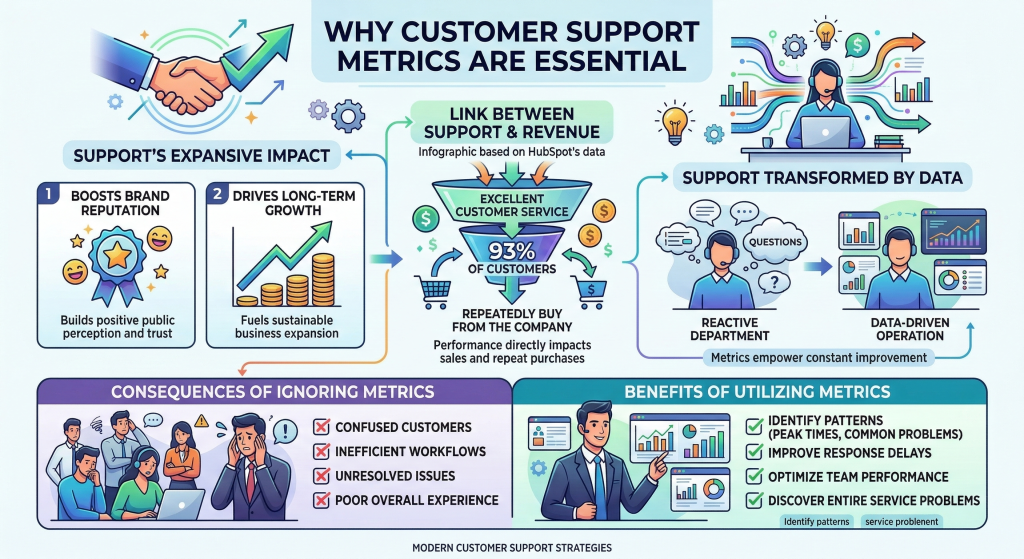
Support metrics aren’t vanity trophies for monthly slide decks. They are the heartbeat of your operational sanity.
Here’s the harsh reality: your product team might build brilliant features and marketing might draft gorgeous copy, but your support team is the only group having real, unvarnished conversations with paying humans every single day. If your tracking strategy is broken, you’re operating completely blind.
Measuring the right metrics gives you three immediate superpowers:
- Expose hidden product friction before it destroys growth. When thirty users submit tickets about a confusing checkout button, that’s not just a ticket—it’s lost revenue.
- Protect your team from total burnout. When you prioritize quality over raw volume, agents stop treating humans like assembly-line widgets.
- Prove support drives revenue. Execs love to slash support budgets because they view it as an expensive sinkhole. Clean metrics give you the exact receipts needed to demand more headcount and better tools.
Without tracking what actually happens inside your queue, you make decisions based on wild guesses or whoever shouts loudest in Slack.
The Trap of Vanity Metrics vs. Operational Reality
Before diving into core numbers, let’s talk about the metrics that trick people.
Take First Response Time. On paper, dropping your average response time from twenty minutes down to thirty seconds sounds like a triumph. But what happens when agents send robotic auto-replies just to stop the timer?
“Hi there! We received your request and are looking into it!”
Great. The clock stopped. But the customer still has a broken billing page, their problem isn’t solved, and now they’re twice as annoyed because you gave them false hope.
The key is finding tools that help you balance speed with real resolution. If you manage ticketing workflows through platforms like Freshworks, you can set up automated routing that puts complex technical issues straight into the hands of tier-two agents.

Similarly, if you run a sprawling organization, pairing customer-facing tools with operational engines like Kissflow ensures cross-departmental escalations—like refund approvals or custom feature requests—don’t die in an email inbox.
The Core Metrics You Should Actually Care About
Skip the fluff. If you want a support setup that works, narrow your focus down to these core indicators.
1. Customer Effort Score (CES)
Stop worrying so much about making every interaction “delightful.” Delight is overrated and wildly expensive.
What users actually want is speed, simplicity, and zero friction. They don’t want a long apology; they just want their password reset so they can get back to work.
CES measures how hard a customer had to work to get an answer. Ask a simple question right after a ticket resolves: “How easy was it to handle your issue today?”
If a user had to exchange nine emails and re-explain their technical problem to four agents, your CES score will plummet—and rightfully so.
2. First Contact Resolution (FCR)
FCR is the undisputed king of support metrics. It tracks the percentage of incoming tickets resolved in a single interaction.
Think about your own experience as a consumer. You reach out, the rep fixes the issue on the spot, and you get on with your day. Zero back-and-forth emails, no endless holds, no hassle.
When your FCR stays high, it tells a clear story: your reps actually have the training, authority, and documentation to solve problems without passing the buck.
3. Customer Satisfaction Score (CSAT) Trendlines
CSAT gets a bad rap because people rely on static monthly averages. A 92% CSAT sounds amazing. But what if that score was 98% two months ago and has been dropping steadily every week?
That’s a red flag.
Don’t look at CSAT as a static badge of honor. Look at the direction it’s moving. Pair your CSAT surveys with short, optional text boxes so users can explain their rating. That raw feedback is where the real gold lives.
4. Self-Service Deflection Rate
Your best support ticket is the one that never gets created.
If hundreds of people open tickets asking, “Where do I download my invoice?”, that isn’t a support problem—it’s a product design failure.
Setting up dedicated knowledge base tools like Help Scout or full help desk platforms like Zendesk gives users a fast way to solve basic issues on their own. Tracking deflection tells you if your help center is taking the heat off your human team so they can focus on thorny problems.ket trends using analytics tools such as Google Analytics combined with help desk data. These insights help teams anticipate demand and prepare staff accordingly.

How to Choose the Right Metrics
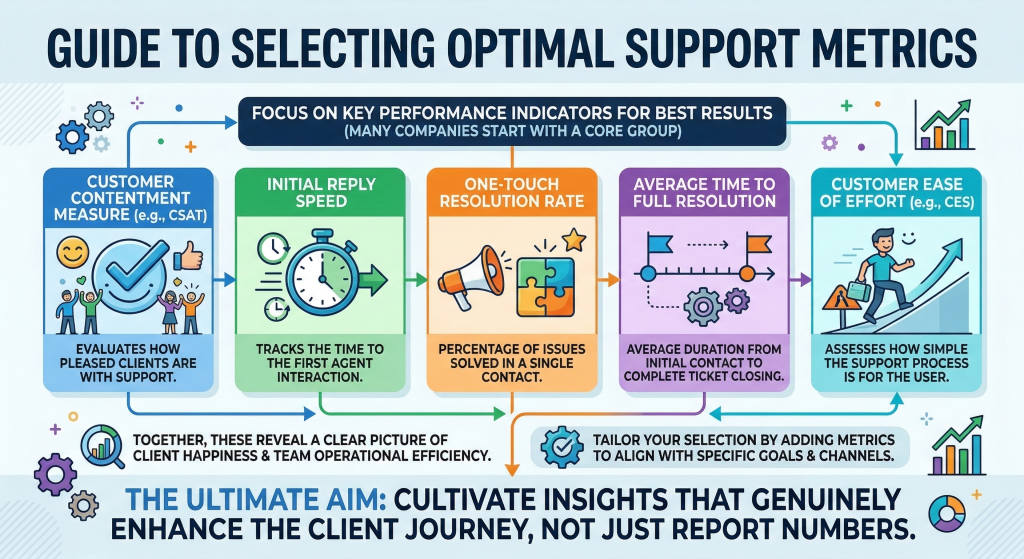
Here’s where teams mess up: they copy-paste someone else’s playbook. What works for a fast-scaling SaaS platform won’t work for a boutique shop or a high-volume fintech app.
Map Metrics directly to Business Pain
Start by asking what’s breaking in your business right now. If churn is bleeding your revenue dry, stop staring at speed metrics and focus heavily on Customer Effort Score and qualitative CSAT feedback. If operational costs are skyrocketing, make First Contact Resolution and self-service deflection your main priorities.
When product adoption stalls out, don’t guess why users are getting stuck. Pair your help desk data directly with analytics platforms like Google Analytics to pinpoint exact pages where visitors drop off and rage-click the support button.
Keep Your Focus Tight and Adapt
Pick three—maybe four—north star metrics for your team. Give agents a clear target instead of twenty competing KPIs that force them to game the system.
Revisit these numbers every quarter. As your company grows from early-stage survival to enterprise scale, your bottlenecks will shift. If a metric stops driving real operational changes, kill it and move on.
Wrap Up
Data is useless without action.
If you spend all your time building elaborate reporting dashboards but never fix product bugs, rewrite confusing docs, or empower your support team, you’re just performing corporate theater.
Take a hard look at your customer support reports today. Strip away the vanity numbers and double down on the few metrics that tell you how your customers actually feel. Your agents will thank you, your churn will drop, and your customers will stick around.


Leave a Comment