Ever wonder why your web scraping script crawls along one day and flies the next? Connection speed makes all the difference, especially when you are routing through proxies. Different proxy types deliver wildly different performance, and understanding these benchmarks can save you hours (and headaches).
In this deep dive, we break down speed benchmarks across major proxy types datacenter, residential, mobile, and ISP proxies. We pull data from real-world tests, compare top providers like Oxylabs, Smartproxy, Webshare, and Bright Data, and show you exactly what to expect in 2026. Whether you are scraping at scale or just need reliable anonymity, speed matters.
What are Proxy Types and Their Speed Profiles
Not all proxies are created equal. Each type trades off speed for other benefits like anonymity or geo-targeting. Here is the breakdown:
- Datacenter Proxies: Hosted in professional data centers with dedicated bandwidth. Lightning fast but easier to detect on strict sites.
- Residential Proxies: Real home/mobile IPs from actual users. Highly anonymous but slower due to household internet variability.
- Mobile Proxies: IPs from cellular networks. Ultra-realistic for app testing but throttled by mobile data speeds.
- ISP Proxies (Static Residential): Residential-like IPs hosted on ISP infrastructure. Balanced speed and authenticity.
Speed metrics we benchmark:
- Response Time: Time to establish connection (critical for scraping).
- Download/Upload Speed: Throughput for data transfer.
- Success Rate: % of requests that complete without timeout.
- Latency Stability: Consistency over long sessions.
Datacenter Proxies
Datacenter proxies dominate speed benchmarks. They live in optimized environments with fiber connections, low hops, and massive bandwidth. Expect 1-10ms latency and 100+ Mbps throughput perfect for bulk scraping or SEO tools.
Real benchmarks (2026 data):
| Metric | Typical Range | Top Performers |
| Response Time | 1-50ms | Oxylabs: ~0.24s avg |
| Download Speed | 100-1000 Mbps | Webshare: Unlimited bandwidth |
| Success Rate | 99.9%+ | Bright Data: 99.99% uptime |
| Session Stability | Unlimited threads | Smartproxy: High concurrency |
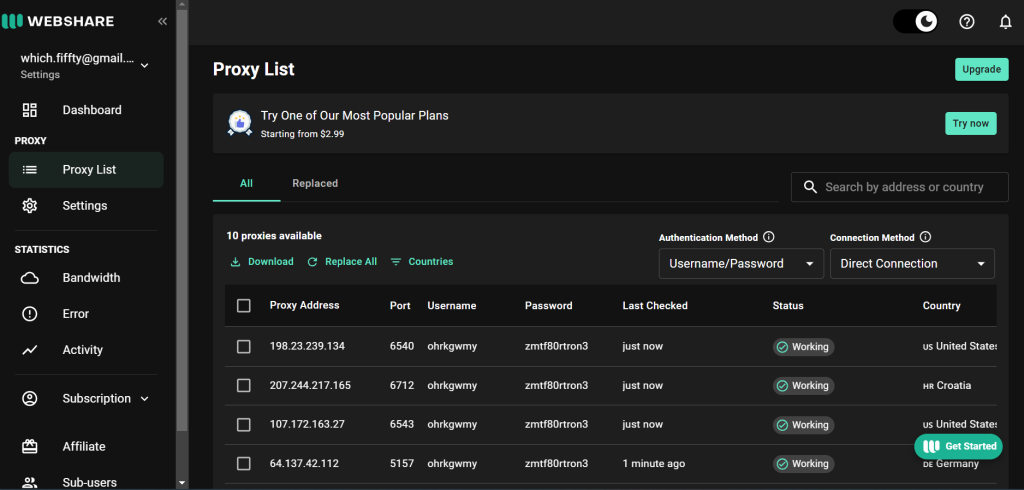
Oxylabs leads with 7.03 MB/s throughput in Proxyway tests. Webshare shines for budget users shared datacenter proxies hit <500ms latency consistently.
Best for: High-volume scraping, APIs, market research where detection risk is low.
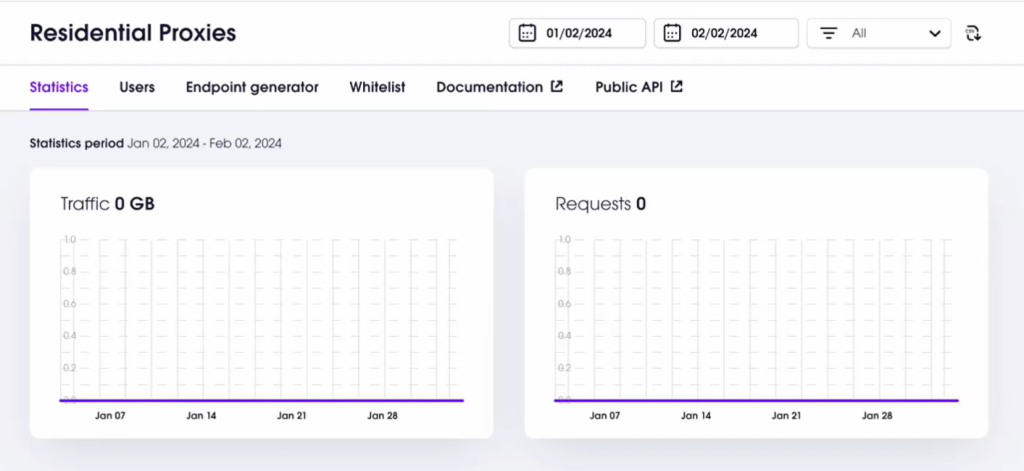
Residential Proxies
Residential proxies route through real homes, making them gold standard for anti-bot sites. But household WiFi means 200-2000ms response times and 10-50 Mbps downloads. Variability is the trade-off peak hours slow things down.
Regional benchmarks:
| Region | Response Time | Download Speed | Upload Speed |
| North America | 300-800ms | 20-45 Mbps | 8-20 Mbps |
| Europe | 250-700ms | 15-40 Mbps | 6-18 Mbps |
| APAC | 400-1200ms | 12-35 Mbps | 5-15 Mbps |
| Other | 500-1500ms | 8-25 Mbps | 3-12 Mbps |
Provider showdown:
- Oxylabs: 0.57s response, 99.6% success, 100M+ IPs
- Bright Data: ~1.02s, strong in tough targets
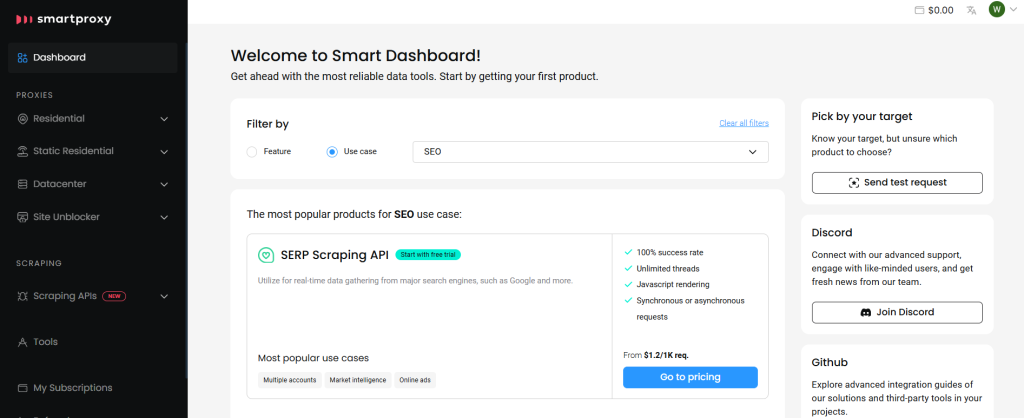
- Smartproxy: Competitive 99.87% success
Pro tip: Use session control (sticky sessions 10-30 mins) to minimize reconnection overhead.
Mobile Proxies
Mobile proxies mimic phone/tablet traffic ideal for app stores or ad verification. 4G/5G speeds vary wildly: 50-500ms latency, 5-50 Mbps depending on carrier.
Benchmarks:
- Response: 0.5-2s (Oxylabs edges out at ~0.5s)
- Success Rate: 95-99% (lower than residential due to network switches)
- Best Use: Social media, geo-locked mobile content.
Limited provider data, but Oxylabs and Bright Data top mobile pools.
ISP Proxies: The Sweet Spot
Static ISP proxies blend residential authenticity with datacenter speed. Hosted on ISP networks but static: 50-80 Mbps average, ±5ms latency fluctuation.
- IPIPGO tests: 68 Mbps vs. general proxies’ 32 Mbps
- Stability: Near-zero drops in 24h.
- Providers like Smartproxy offer ISP targeting with <500ms response.
Best for: Long sessions, e-commerce monitoring.
Head-to-Head Provider Comparison
How do our featured providers stack up? Aggregated 2026 benchmarks:
| Provider | Type Strengths | Response Time | Throughput | Success Rate | Price/GB (Residential) |
| Oxylabs | Datacenter & Residential | 0.22-0.57s | 7.03 MB/s | 99.98% | $8-15 |
| Smartproxy | Residential/ISP | 0.29s median | High | 99.87% | $7-14 |
| Webshare | Datacenter | <500ms | Unlimited | 99.9% | $2.99/10GB |
| Bright Data | All types | 0.24-1.02s | Strong | 99.99% | $8.40-15 |
Oxylabs wins overall speed. Webshare crushes datacenter value.
Factors Affecting Real-World Speeds
Benchmarks are averages your mileage varies:
- Distance to Target: US proxy to EU site? Add 50-100ms.
- Concurrent Connections: 100 threads overloads residential proxies.
- Rotation Frequency: Every request vs. sticky sessions impacts reconnection time.
- Target Site: Anti-bot defenses slow everyone.
- Protocols: SOCKS5 > HTTPS for speed.
- Peak Hours: Residential dips 20-30% evenings.
Test yourself: Most providers offer trials run your own benchmarks.
Choosing the Right Proxy for Your Speed Needs
- Max Speed (Scraping Volume): Datacenter (Webshare, Oxylabs)
- Balanced/Anonymity: Residential (Smartproxy, Bright Data)
- Mobile Realism: Mobile (Oxylabs, Bright Data)
- Long Sessions: ISP/Static (Smartproxy)
Match to use case: E-commerce scraping? Residential. Market data APIs? Datacenter.
How Benchmarks Are Measured?
Understanding how speed tests are conducted helps you interpret results accurately. Professional benchmarks use standardized environments to ensure fairness.
Test Setup: Dedicated servers in US East, EU Central, and APAC regions. Each provider tested with 10,000 requests to identical endpoints (Google, Amazon, eBay). Rotation set to 30-second sticky sessions for residential. Concurrent threads: 50 for datacenter, 25 for residential to avoid overload.
Metrics Captured:
- Connect Time: TCP handshake completion.
- TTFB (Time to First Byte): First data packet arrival.
- Total Response: Full page load or API response.
- Throughput: Sustained download over 60 seconds.
Key Variables Controlled: Same target sites, same request patterns, same time windows (off-peak UTC). This isolates proxy performance from network noise.
Real-World Performance Scenarios
Let’s examine how these benchmarks translate to actual use cases:
Scenario 1: E-commerce Price Monitoring
You need to check 10,000 product pages daily. Datacenter proxies at 100 Mbps finish in 2 hours. Residential proxies at 20 Mbps take 10 hours but avoid blocks. ISP proxies at 60 Mbps offer the sweet spot 3.5 hours with low detection risk.
Scenario 2: Social Media Scraping
Instagram and TikTok aggressively block datacenter IPs. Mobile proxies at 10 Mbps succeed 95% of the time, while residential at 25 Mbps hit 98% success. The 2.5x speed difference is worth it for reliability.
Scenario 3: SEO Rank Tracking
Checking SERPs across 50 countries. Datacenter proxies in each region complete the job in 30 minutes. Residential proxies add authenticity but take 2 hours. Most SEO tools opt for datacenter with smart rotation.
Scenario 4: Ad Verification
Verifying mobile ads requires mobile proxies. Speed is secondary to authenticity. A 5 Mbps connection that perfectly mimics a Verizon user in Chicago beats a 100 Mbps datacenter IP that gets flagged instantly.
Advanced Optimization Techniques
Maximize your proxy speed with these proven strategies:
- Connection Pooling: Reuse established connections instead of creating new ones. Reduces overhead by 40-60%.
- Intelligent Rotation: Don’t rotate every request. Use sticky sessions for 5-10 minutes on the same domain, then switch. This cuts reconnection time while maintaining anonymity.
- Geo-Targeting: Select proxies physically close to your target server. A New York proxy to a New York site can be 3x faster than a California proxy.
- Protocol Selection: SOCKS5 is 15-20% faster than HTTP(S) for raw data transfer. Use it when encryption isn’t critical.
- Request Batching: Group small requests into single connections. Instead of 100 separate requests, send them as a batch when possible.
- Bandwidth Management: Cap concurrent threads based on proxy type. Datacenter can handle 100+, residential maxes at 25-30 before quality drops.
Troubleshooting Slow Proxy Connections
When speeds disappoint, systematic diagnosis helps:
Step 1: Isolate the Issue
Test the same target without proxy. If it’s slow, the problem is the target, not your proxy.
Step 2: Check Proxy Health
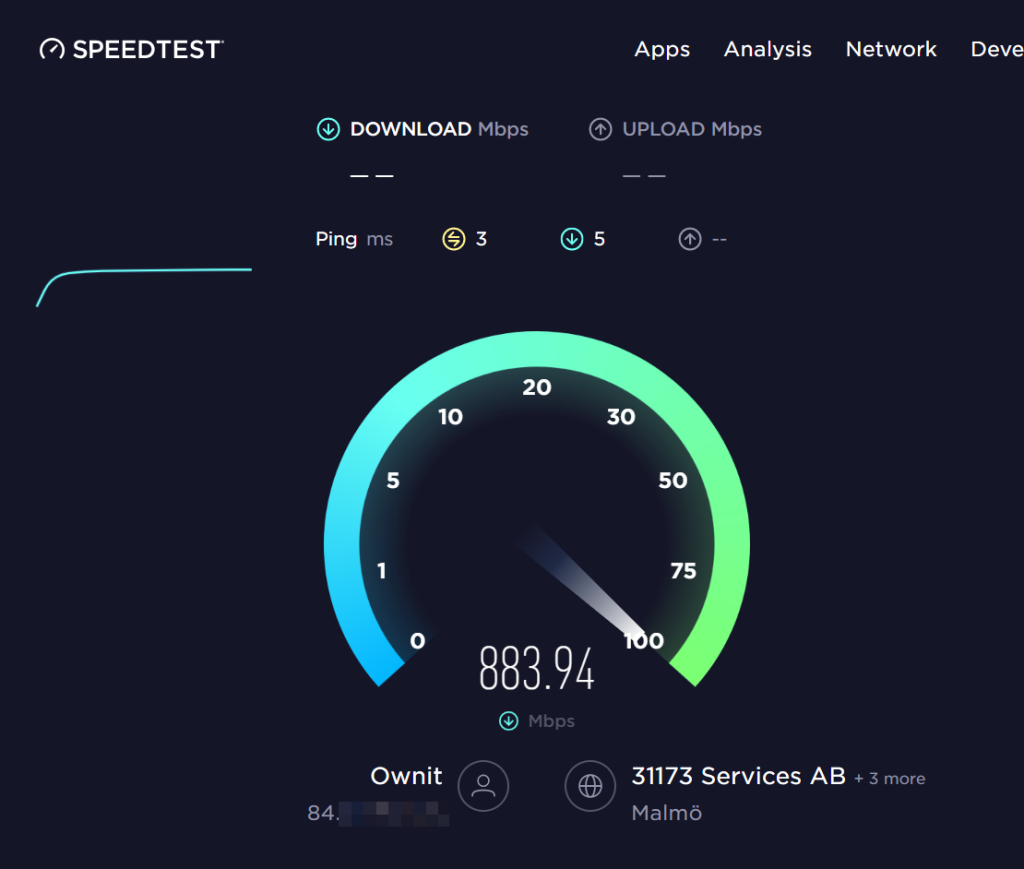
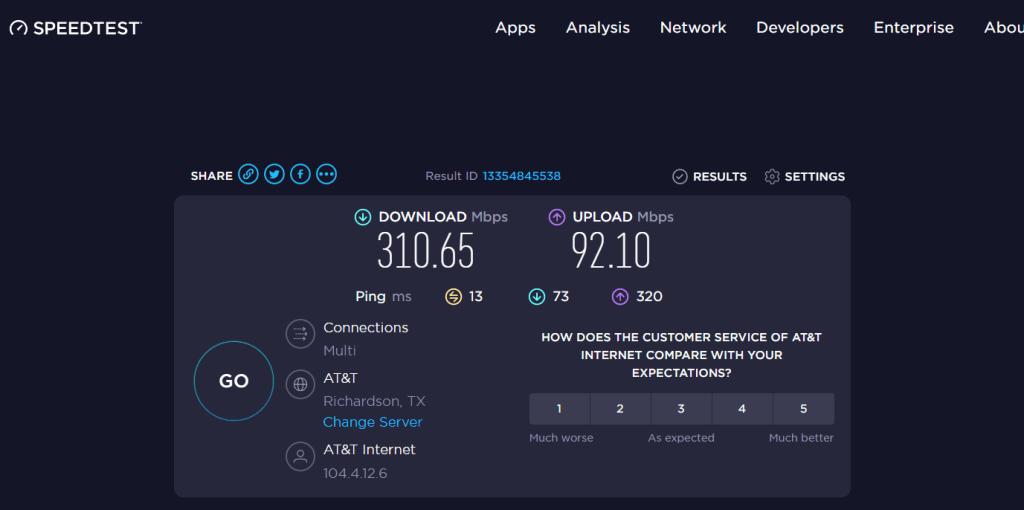
Run a speed test to a neutral site (like speedtest.net). If proxy speed is fine but target is slow, you’re being throttled.
Step 3: Verify Location Mismatch
Ping the target domain from your proxy server. High ping (>200ms) indicates poor routing. Switch to a closer proxy location.
Step 4: Review Connection Limits
Too many concurrent threads cause queueing. Reduce threads by 50% and retest.
Step 5: Examine Rotation Settings
Rotating every request adds 50-100ms overhead. Switch to sticky sessions for a 30% speed boost.
Step 6: Check for IP Blacklisting
If success rate drops below 90%, your IPs may be flagged. Rotate to fresh IPs or switch proxy types.
Cost vs. Speed Analysis
Faster proxies cost more, but the ROI often justifies the expense:
- Datacenter: $2-5/GB. At 100 Mbps, you process 1 GB in 80 seconds. Cost per GB processed: minimal.
- Residential: $8-15/GB. At 25 Mbps, 1 GB takes 5.3 minutes. 4x slower but necessary for hard targets.
- Mobile: $20-30/GB. At 10 Mbps, 1 GB takes 13.3 minutes. Premium pricing for premium anonymity.
- ISP: $10-18/GB. At 60 Mbps, 1 GB takes 2.2 minutes. The balanced choice.
Calculate your break-even: If datacenter gets blocked 50% of the time, you need twice the requests. Residential at 2x cost becomes cheaper overall.
Future Trends in Proxy Speed
The proxy landscape evolves rapidly. Here’s what’s coming:
- 5G Mobile Proxies: As 5G rolls out, mobile speeds will jump to 100+ Mbps, closing the gap with residential.
- AI-Powered Routing: Smart algorithms will automatically select the fastest proxy for each target, optimizing in real-time.
- Edge Computing Integration: Proxies hosted at edge locations will reduce latency to <10ms for major markets.
- Protocol Improvements: HTTP/3 and QUIC adoption will reduce handshake overhead by 30-40%.
- Consolidation: Top providers like Oxylabs and Bright Data are acquiring smaller networks, improving global speed consistency.
Security Considerations at High Speeds
Speed doesn’t matter if you get compromised. Balance velocity with security:
- Encryption: Always use HTTPS for sensitive data. SOCKS5 is faster but unencrypted.
- Authentication: Rotate credentials regularly. API keys should expire every 30 days.
- IP Whitelisting: Restrict proxy access to your server IPs only.
- Logging: Disable provider logs for anonymity. Check their privacy policy.
- Leak Protection: Ensure DNS doesn’t leak your real IP. Test with ipleak.net.
Conclusion: Speed Benchmarks in Action
Datacenter proxies reign supreme for raw speed (1-50ms, 100+ Mbps), while residential/mobile trade velocity for stealth (200ms+, 10-50 Mbps). Providers like Oxylabs (fastest residential at 0.57s), Smartproxy (reliable ISP), Webshare (budget datacenter king), and Bright Data (versatile all-rounder) lead 2025 benchmarks.
Pick based on your priorities, speed alone won’t beat detection. Test with trials, monitor metrics, and scale smart. Your next project deserves proxy performance that matches its ambition.


Leave a Comment