If lead generation feels more expensive every year, you are not imagining it. Many teams can still generate leads at a reasonable cost, but the real budget drain often shows up later, when those leads are not qualified enough for sales. That is why cost per qualified lead matters more than plain cost per lead.
This blog breaks down the most useful cost per qualified lead statistics, what they really mean, and how to use them to plan budgets, pick channels, and stop paying for low-quality leads. It is written in simple English, with practical examples and clear takeaways.
What “Cost Per Qualified Lead” Really Means
Before jumping into numbers, it helps to clear up the terms. People often mix these up:
- CPL (Cost Per Lead): What you pay to get a lead, such as a form fill.
- MQL (Marketing Qualified Lead): A lead that meets your marketing criteria, like company size, role, or engagement level.
- SQL (Sales Qualified Lead): A lead sales has reviewed and believes is likely to convert.
- CPQL (Cost Per Qualified Lead): The cost to generate a lead that is actually qualified (usually MQL or SQL, depending on your definition).
Here is why it matters: A “cheap” lead can be expensive if it never becomes a real opportunity.
A simple way to look at it:
- You spend money on marketing.
- You collect leads.
- Only some leads become qualified.
- Your real cost is what you spent divided by the qualified leads.
If you spend $10,000 and get 500 leads, your CPL is $20.
If only 50 are qualified, your CPQL is $200.
That is the number that tells the truth.
Why CPQL Is the Metric That Finance and Sales Care About
CPQL connects marketing spend to sales reality. When CPQL drops, sales usually gets better conversations. When CPQL rises, sales wastes time, and revenue slows down.
Tracking CPQL helps you:
- Stop chasing vanity metrics. You can get leads all day, but qualified leads are what matter.
- Build trust with sales. CPQL aligns marketing with pipeline goals.
- Spend smarter. You can increase budget on channels that bring qualified leads, not just cheap ones.
- Improve forecasting. You can estimate how many qualified leads a budget can realistically produce.
In many companies, the fastest way to reduce CPQL is not “spend less.” It is improving targeting, lead scoring, and the qualification process.
Key Lead Generation Cost Statistics (CPL)
Even though this post focuses on qualified leads, you still need CPL benchmarks because CPQL is built on top of CPL.
Here are some widely shared benchmarks for cost per lead:
- WordStream reported the average Google Ads cost per lead increased from $66.69 in 2024 to $70.11 in 2025, a 5.13% year-over-year increase.
- That same data highlights how much CPL varies by industry, even inside Google Ads.
This is a useful reminder: there is no single “good” CPL. The right benchmark depends on your industry, deal size, and sales cycle.
The Big Stat: Average CPL Across Industries
Some benchmark roundups put the average cost per lead across industries around $198. That number is often high because industries like legal and finance pull the average up.
What matters for your team is not the overall average. It is:
- Your industry benchmark
- Your channel mix
- Your conversion rates from lead to qualified lead
Qualified Lead Statistics That Change How You Budget
Now let’s talk about the stats that impact CPQL directly.
MQL to SQL Conversion Benchmarks
Even if you generate strong MQLs, not all of them become SQLs. A benchmark source reported that MQL to SQL conversion rates in 2025 vary by industry, with averages ranging from 12% to 21%.
This matters because CPQL for SQLs can rise quickly if your MQL-to-SQL conversion rate is weak.
Example:
- CPL = $70
- Lead-to-MQL = 30%
- MQL-to-SQL = 15%
Then:
- Cost per MQL = $70 / 0.30 = $233
- Cost per SQL = $233 / 0.15 = $1,553
This is why some teams panic when they “have leads” but still cannot fill pipeline. The math makes it obvious.
Why Low CPL Can Be a Trap
Some channels create very low CPL, but those leads need heavy nurturing and do not qualify well. Meta ads are a common example of this because they can generate lots of top-of-funnel leads.
A benchmark index noted Meta (Facebook/Instagram) average CPL around $27.66, while Google Search CPL averaged $70.11 and LinkedIn was often higher.
That does not mean Meta is “better.” It means Meta often brings cheaper leads that may not be ready, and your qualification rate becomes the deciding factor.
So the question is not “What channel has the lowest CPL?”
It is “What channel has the lowest CPQL for our definition of qualified?”
CPQL Benchmarks by Channel (What to Expect)
There is no perfect universal benchmark for CPQL, because “qualified” means different things in different companies. Still, the channel patterns are consistent.
Google Search: Higher Intent, Stronger Qualification
Search leads tend to be more qualified because the user is actively looking for a solution. Benchmarks show Google Ads average CPL at $70.11 in 2025.
That makes search a strong candidate for lower CPQL, especially if:
- Your landing pages are focused
- Your offer matches the keyword intent
- You qualify leads quickly
LinkedIn: Expensive Leads, Often Better Fit for B2B
LinkedIn tends to be more expensive because it is built for professional targeting. A benchmark index reported an average LinkedIn CPL around $110, with ranges commonly higher depending on targeting.
LinkedIn often works best when:
- Your deal size is high
- Your sales cycle is longer
- You need specific job titles or company sizes
Meta: Cheap Leads, CPQL Depends on Your Funnel
Meta can produce cheap leads, but qualification depends on your offer and follow-up process. If your lead scoring is weak or your nurture is slow, CPQL can climb fast.
Meta is often best for:
- Email list building
- Content downloads
- Webinar registrations
- Retargeting warm audiences
CPQL by Industry: Why Some Teams Pay More
Industry plays a huge role because competition and deal size vary.
A B2B cost benchmark update shared examples like:
- IT and managed services average CPL around $501
- Software development CPL around $595
If your industry has high CPL, it does not automatically mean you are failing. It may just be a competitive market where customers are valuable and advertising is expensive.
What matters is whether CPQL makes sense relative to:
- Average contract value
- Gross margin
- Close rate
- Customer lifetime value
If you sell $50,000 contracts, a $700 CPQL might be totally fine.
If you sell $49 subscriptions, it is not.
What Drives CPQL Up or Down
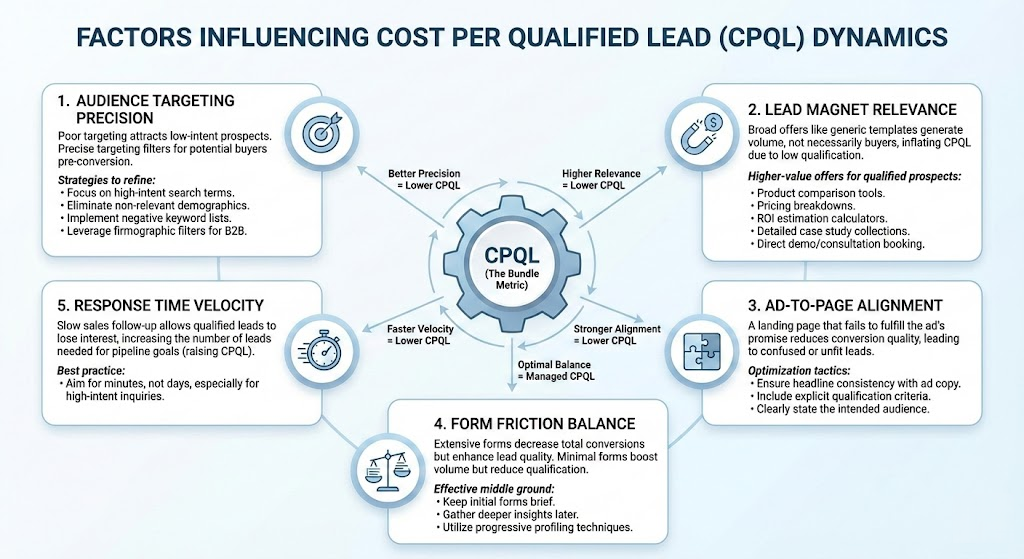
Think of CPQL as a “bundle metric.” Many smaller factors push it.
Here are the biggest drivers:
1. Targeting Quality
Bad targeting brings low intent leads. Good targeting filters people before they convert.
To improve targeting:
- Tighten keyword intent
- Exclude irrelevant audiences
- Use negative keywords
- Filter by firmographics in B2B
2. Offer Quality
A “free template” can bring lots of leads. But are those leads buyers? Maybe, maybe not.
If your offer is too broad, CPQL rises because qualification rates drop.
Better offers for qualified leads:
- Product comparison guide
- Pricing guide
- ROI calculator
- Case study pack
- Demo or consultation
3. Landing Page Match
When a landing page does not match the promise of the ad, conversion quality drops. You might still get leads, but they will be confused or unqualified.
Quick fixes:
- Match headline to ad
- Add clear qualification points
- Be upfront about who it is for
4. Lead Capture Friction
More form fields often reduce conversions but improve lead quality. Fewer form fields often increase leads but lower qualification.
A common balanced approach:
- Keep initial form short
- Ask qualifying questions later
- Use progressive profiling
5. Speed to Lead
If sales takes two days to respond, your qualified leads go cold. CPQL rises because you need more leads to hit pipeline targets.
A good rule: follow up within minutes when possible for high intent leads.
How to Calculate CPQL (Simple, Practical)
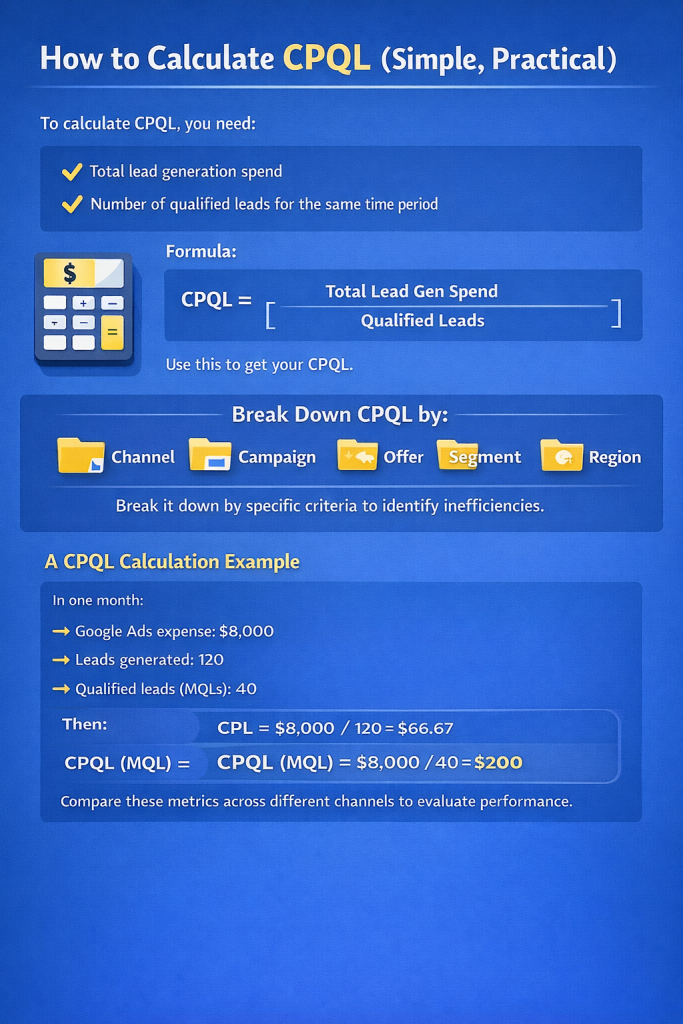
To calculate CPQL, you need:
- Total lead generation spend
- Number of qualified leads in that same period
Formula:
CPQL = Total Lead Gen Spend / Number of Qualified Leads
That is it.
But for cleaner insight, calculate CPQL by:
- Channel
- Campaign
- Offer
- Segment
- Region
That is how you find where the waste is.
A Quick CPQL Example
Let’s say in one month:
- Google Ads spend: $8,000
- Leads: 120
- MQLs: 40
Then:
- CPL = $8,000 / 120 = $66.67
- CPQL (MQL) = $8,000 / 40 = $200
Now you can compare that to other channels.
How to Use CPQL Stats Without Getting Misled
A lot of teams make mistakes with benchmarks.
Here is how to stay sane:
- Do not compare your CPQL to someone else’s without context. Your qualification rules might be stricter.
- Compare CPQL to revenue outcomes. Low CPQL is useless if close rate is weak.
- Look at trends, not one month. CPQL can spike due to seasonality or one campaign change.
- Track both MQL and SQL CPQL. Marketing and sales qualification are different.
How to Lower CPQL Without Killing Lead Volume
Lowering CPQL does not always mean reducing spend. Often, it means improving the system.
Here are practical ways to do it.
Improve Lead Scoring
Lead scoring helps you define “qualified” based on fit and intent.
Scoring inputs can include:
- Job title
- Company size
- Industry
- Pricing page visits
- Webinar attendance
- Product usage
When scoring is clear, sales focuses on the right leads, and your qualified lead counts become more accurate.
Tighten Definitions with Sales
Marketing and sales must agree on what qualified means.
A simple way to align is to write down:
- Must-have criteria
- Nice-to-have criteria
- Disqualifiers
This stops the classic fight where marketing says “we delivered leads” and sales says “they were junk.”
Fix Your Funnel, Not Just Your Ads
CPQL is often a funnel issue:
- Weak nurture sequence
- Slow follow-up
- Poor onboarding emails
- No retargeting
Improving these can raise qualification rates without spending more.
Use Retargeting to Warm Up Leads
Retargeting can help leads become qualified later. You might pay more clicks, but qualification rates improve.
This is especially helpful for:
- High-ticket B2B
- Competitive industries
- Long sales cycles
A Simple CPQL Tracking Dashboard (What to Include)
If you want a dashboard that makes sense, track these monthly:
- Spend by channel
- Leads by channel
- MQLs by channel
- SQLs by channel
- CPQL (MQL) by channel
- CPQL (SQL) by channel
- Close rate by channel
- Revenue by channel
That is enough to make better budget decisions.
Wrap Up
Lead generation costs will keep changing, but CPQL gives you a steady way to measure what really matters. CPL is useful, but it can trick you. A low CPL does not help if sales cannot use the leads.
If you want better results, start with three steps:
- Define what “qualified” means with sales.
- Track CPQL by channel and campaign, not just overall.
- Improve qualification rate through better targeting, offers, and follow-up.
Once you do that, you will spend less time arguing about lead quality and more time building a predictable pipeline that actually converts.


Leave a Comment